Most desks in this market bought AI capability inside the last two years. We spent that time asking them what still gets in the way.
From 600+ hours of conversations with mining capital desks and client implementations. Funds, royalty and streaming, corporate development, advisory, miners and sovereigns. Set against a survey of 122 senior mining finance executives and professionals across 23 countries.
The full research report is a free download, below.
The findings
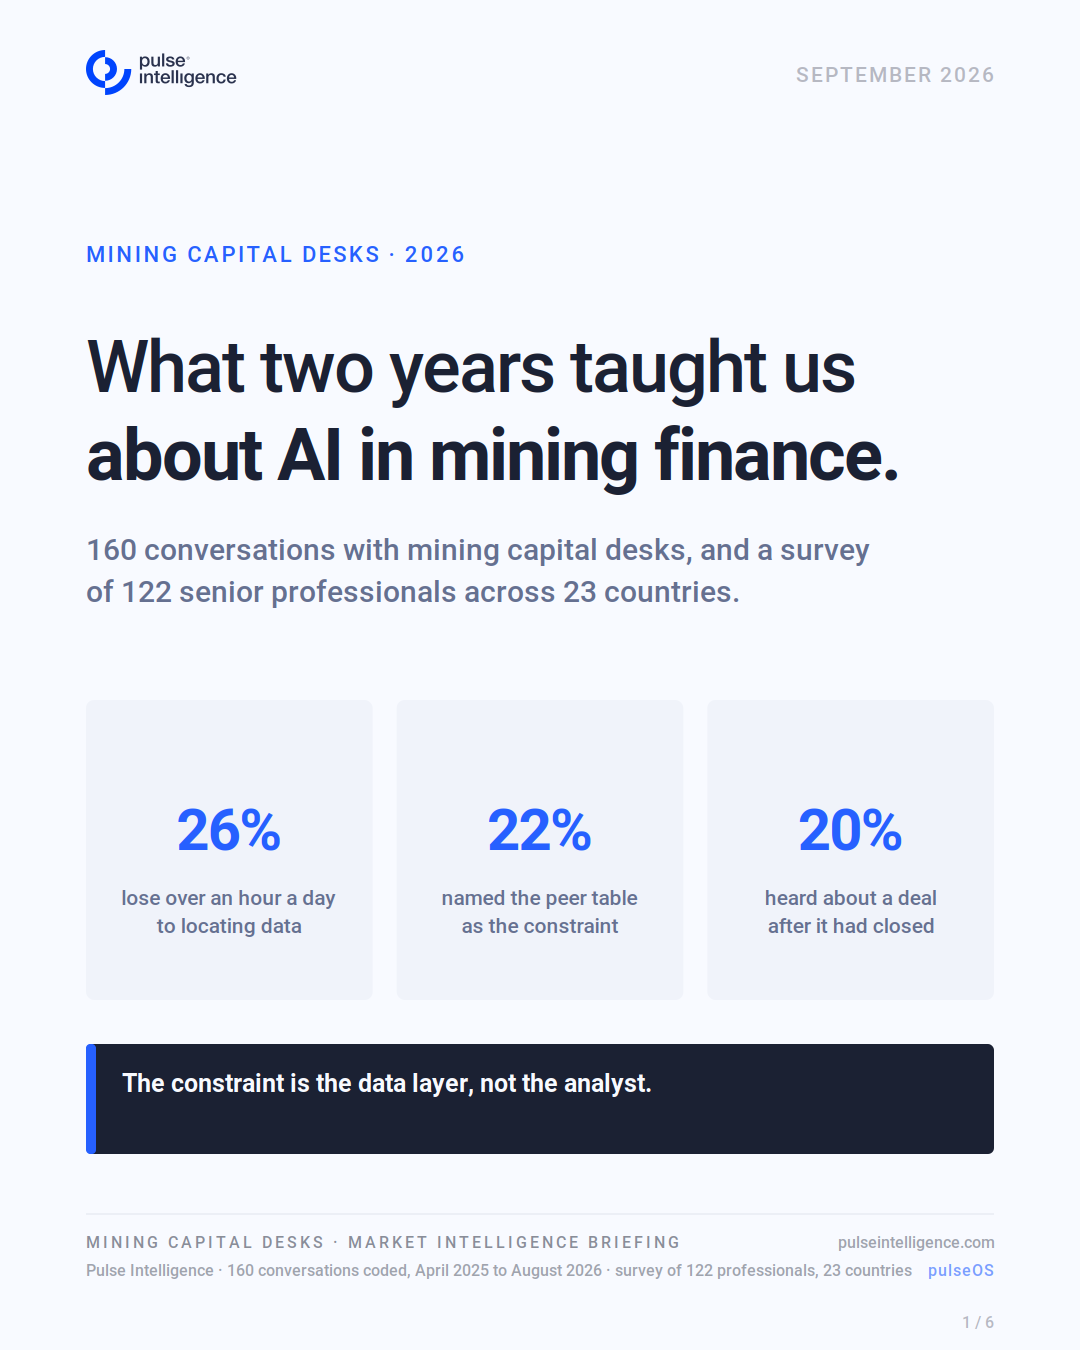
- 26% of senior professionals lose more than an hour a day to locating data.
- Another 43% lose half an hour to an hour.
- At the top end, that is 15 hours a week, which is up to seventeen weeks a year, per person, spent finding a figure rather than using it.
Thirty-seven constraints
Thirty-seven distinct constraints were named across those conversations. Ranked by the share of conversations in which each was reported:
- 22% building a peer table they can trust
- 20% hearing about a deal after it had closed
- 17% incumbent data that is stale or thin exactly where mining is deep
- Portfolio monitoring at scale (14%)
- Documents scattered and unusable (13%)
- Metrics buried inside technical reports (12%)
- Tracing a number back to its source and work spread across tools and logins (11% each)
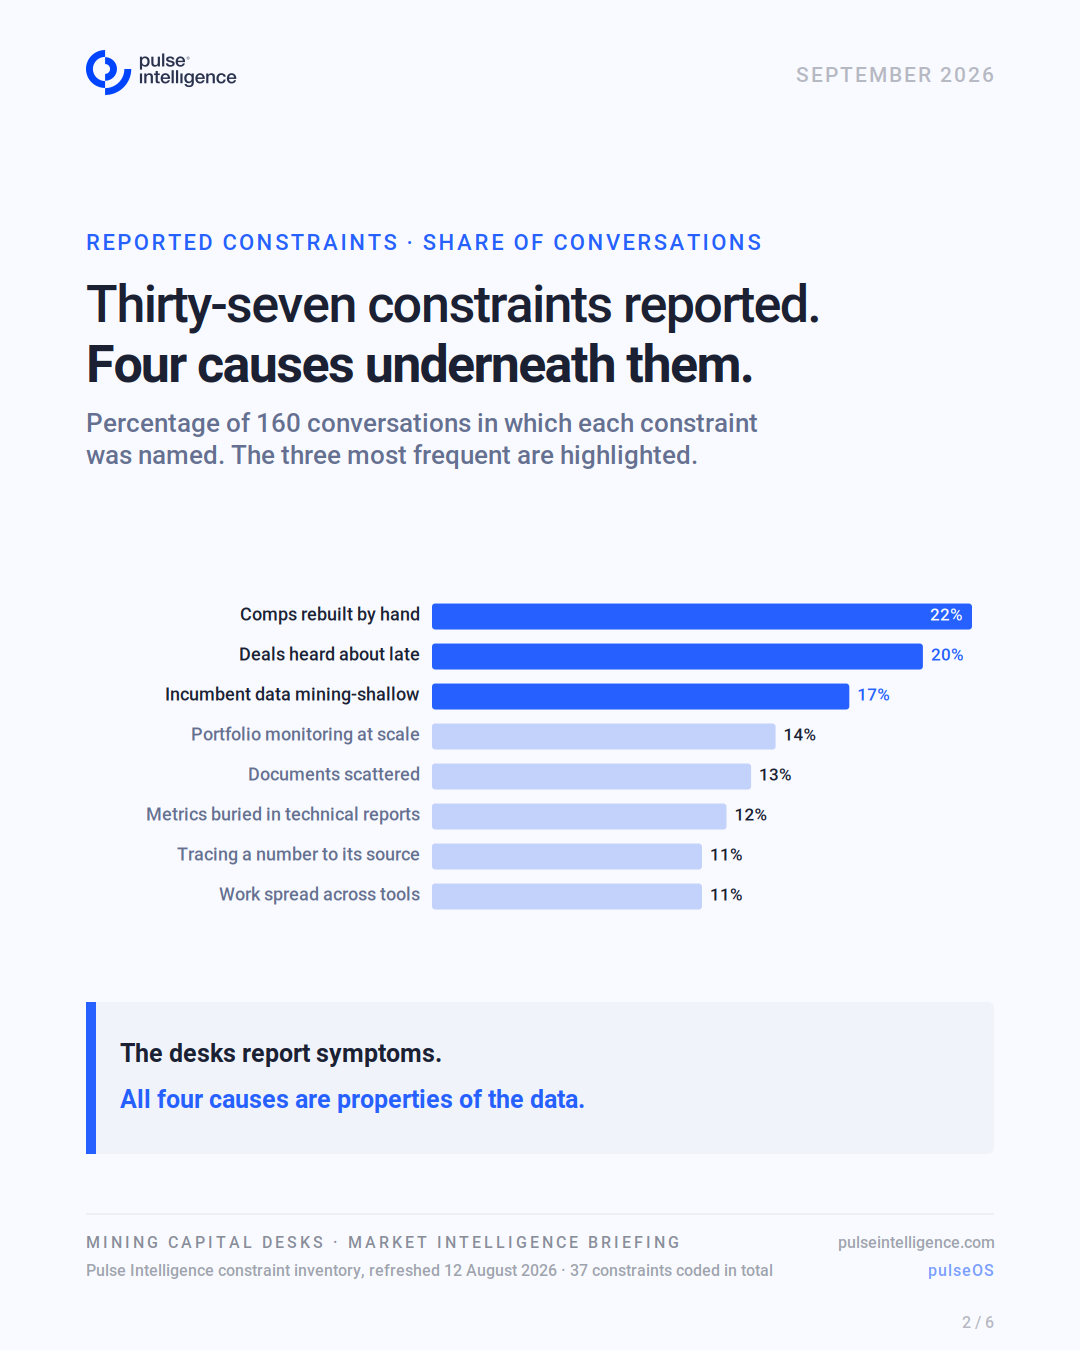
Coded properly, those thirty-seven reduce to four causes, and every one of them is a property of the data rather than the desk.
- Fragmentation. Data sits across filings, exchange portals, PDFs, government databases, servers and a dozen tools. No single system holds it, so the analyst becomes the integration layer.
- No canonical source. No system of record, no audit trail. Figures are restated between the study, the presentation and the release, so every desk builds its own version and then has to defend it.
- Platforms that are mining-shallow. General platforms are thinnest exactly where this market is deepest: royalties and streams, reserves and resources, private companies, thin critical-mineral price markets, and the economics buried inside technical reports.
- Rigidity. The newest one. In six separate conversations the data existed, but the bespoke screen could not be built, or was quoted at a price nobody would pay. One royalty desk described trying for years and getting nowhere.
Time and cost
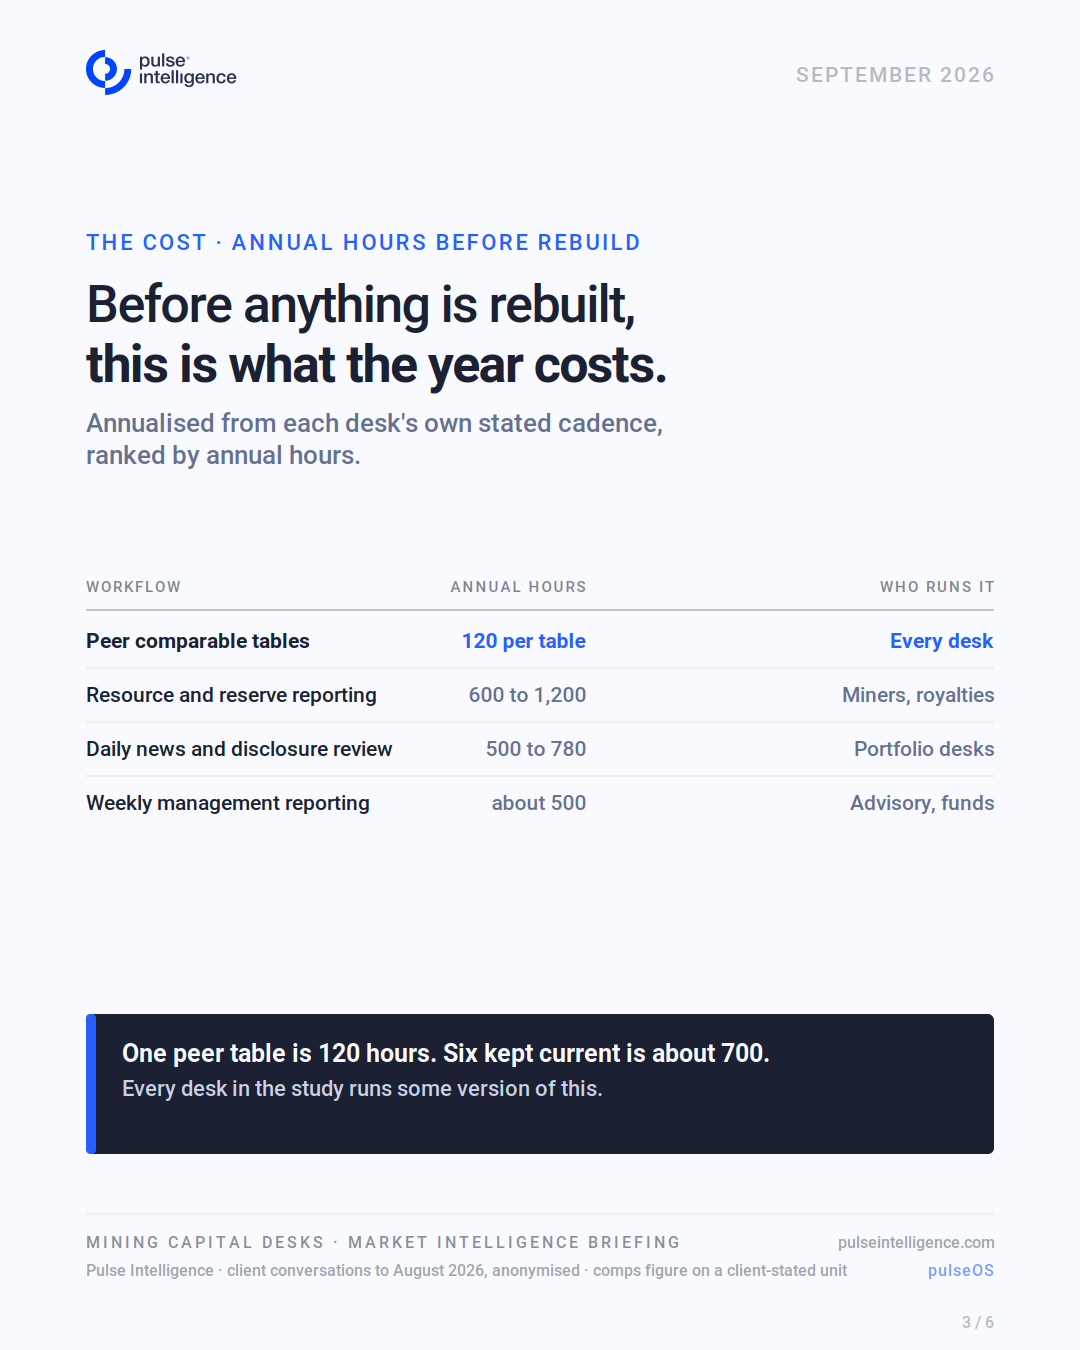
Then there is the annual time and cost bill, annualised from each desk's own stated cadence. A single peer comp or benchmark table can take up to 120 hours a year to keep current, roughly 700 across six. Resource and reserve reporting, 600 to 1,200 hours. Daily news and disclosure review, 500 to 780. Weekly management and board reporting, about 500.
Where the AI spend goes
Most of these institutions have bought AI capability in the last two years, and the published research is fairly consistent about where it fails.
- RAND puts 60% of AI project failures down to data-related root causes.
- Gartner has 48% of 1,400 CIOs naming data quality as their single greatest obstacle.
- PwC scores mining's AI fitness at 4.7 against a 5.3 cross-industry median, the lowest of any sector.
The constraint was never the model. It sits in the layer underneath it.
What changes when the layer underneath is right
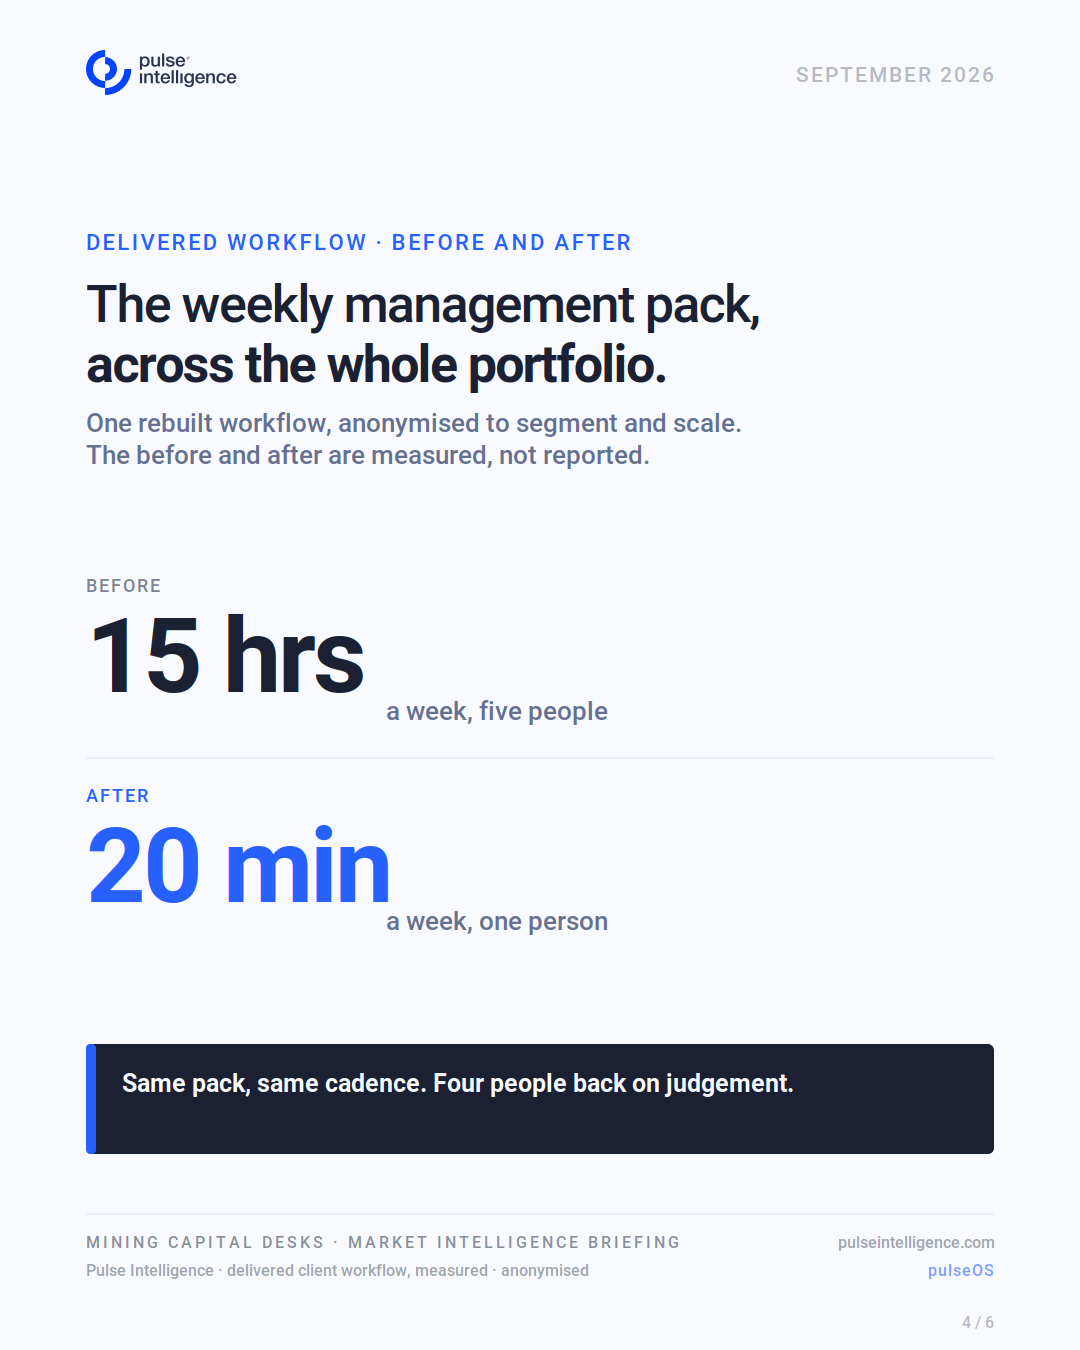
One rebuilt workflow, anonymised. A weekly management pack across a whole portfolio that took five people fifteen hours a week now takes one person about twenty minutes. Same pack, same cadence, four people back on judgement.
Get the research report
Five pages. Enter your email and we'll send the full briefing over. No login, no sales call.
Less searching. More strategising.™
Evidence base: 160 conversations coded from a 560-recording history, April 2025 to August 2026, spanning live client implementations, consulting engagements and research interviews. Internal and fundraising calls excluded. Institutions appear more than once, so conversation counts are not firm counts and the share of firms reporting a constraint is higher than its share of conversations. Survey figures: Pulse Intelligence, Chaos to Clarity, September 2024, 122 respondents across 23 countries, percentages as published. Workflow hours are annualised from each desk's own stated cadence, anonymised. The rebuilt weekly management pack is measured, not client-reported. Third-party figures on their own basis and date: RAND (2024); Gartner (2026); PwC Mine 2026. This document is public and not investment advice.
Where does your team's data infrastructure sit today?
Answer 10 questions. Get a private diagnostic on your AI readiness, in minutes.
Less Searching. More Strategising.™
See the platform running on real mining data. Book a demo to see what this looks like for your team.