How much gold is in this mine? It sounds like a question with one answer. It isn't — and Nevada Gold Mines is the clearest example of why.
Nevada Gold Mines is one of the world's largest gold mining complexes. Ask two analysts how big it is and you will get two different numbers. Both will be correct. Neither will tell you why they differ, or which one to use.
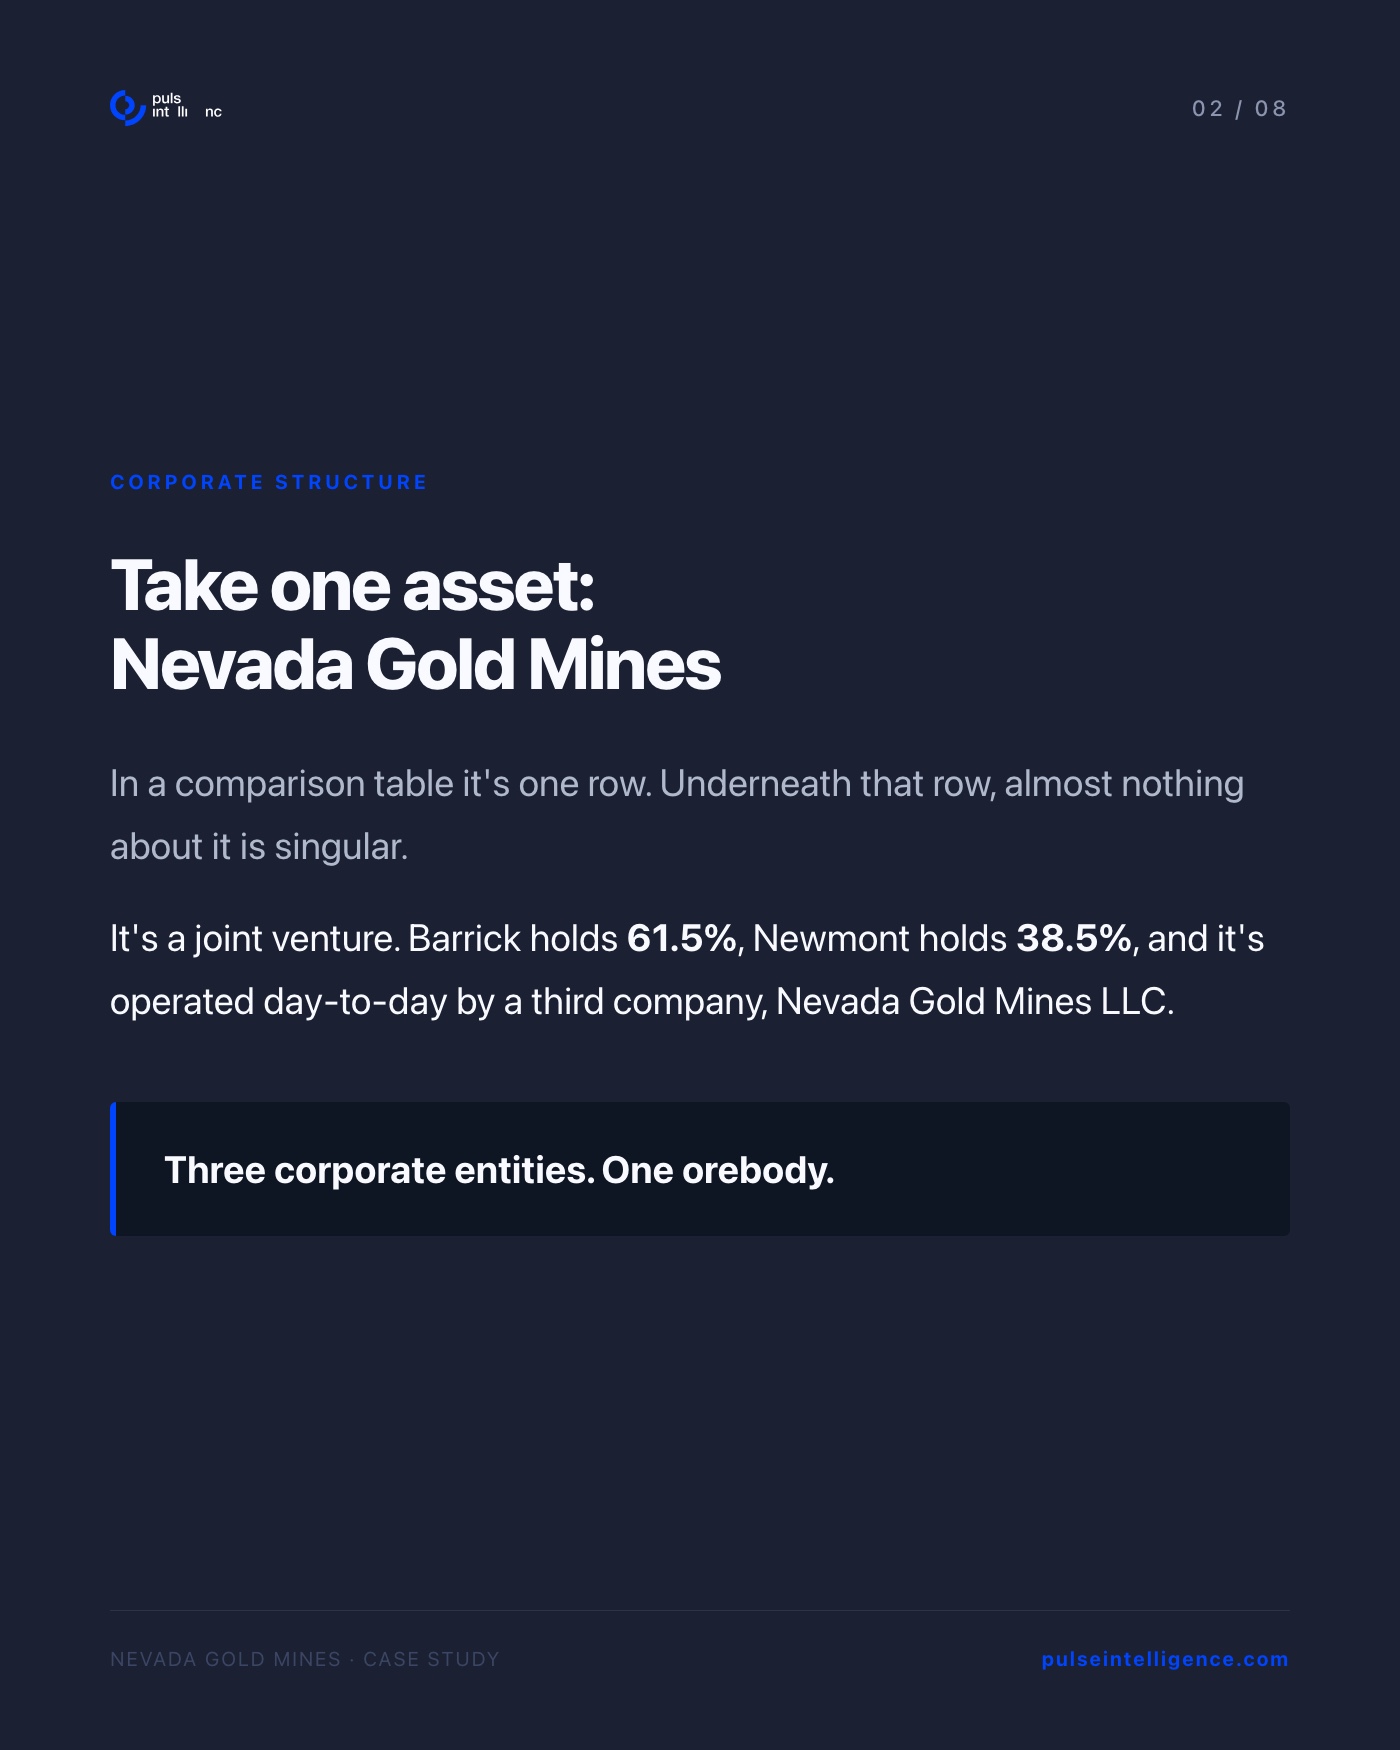
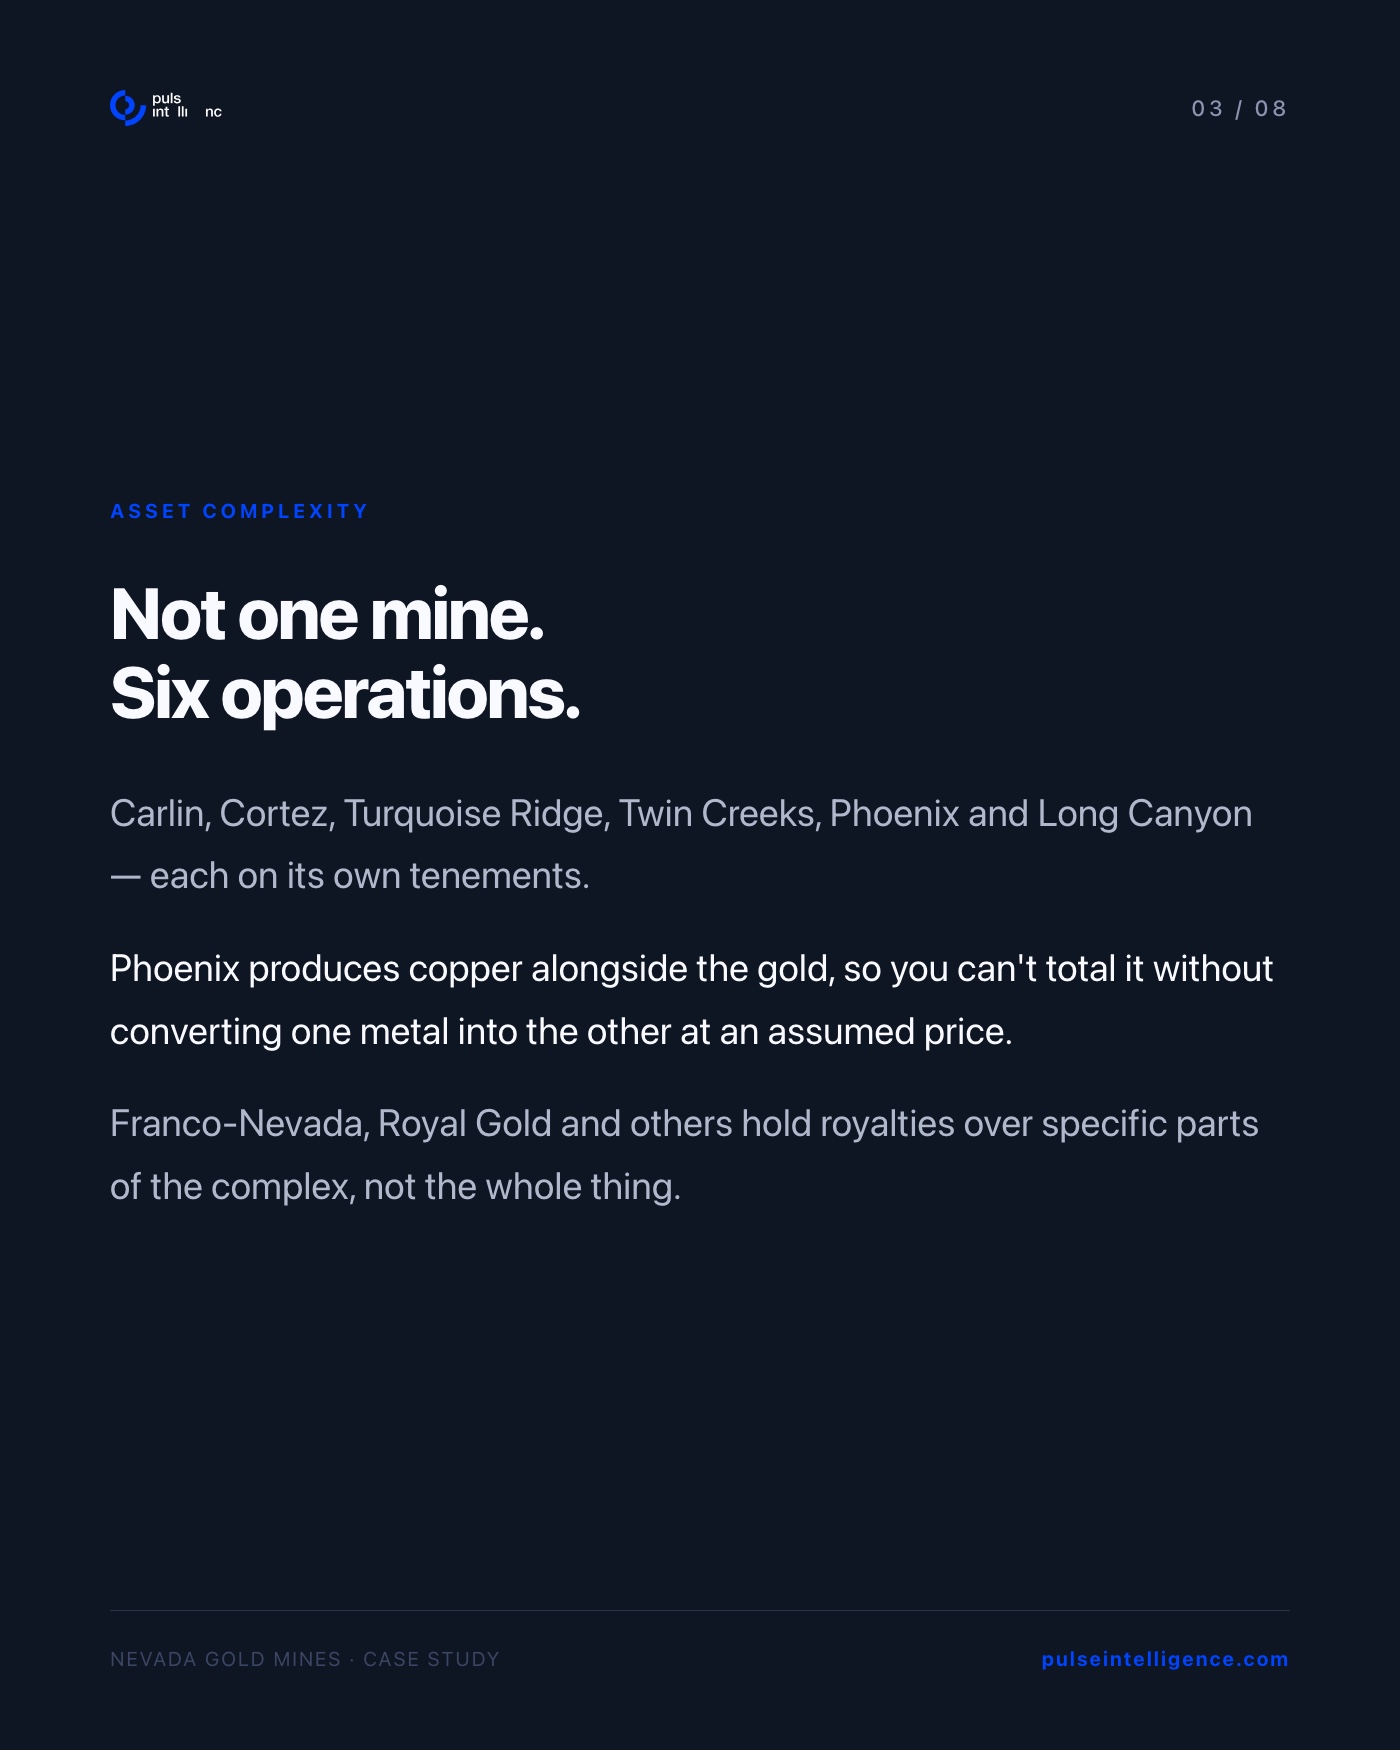
The complexity starts with the structure. Nevada Gold Mines is a joint venture: Barrick holds 61.5%, Newmont holds 38.5%, and day-to-day operations are managed by a third entity, Nevada Gold Mines LLC. Underneath that single name sit six distinct operations — Carlin, Cortez, Turquoise Ridge, Twin Creeks, Phoenix and Long Canyon — each on its own tenements, with separate royalty holders (Franco-Nevada, Royal Gold and others) attached to specific parts of specific orebodies. Phoenix also produces copper alongside gold. Three corporate entities. Six operations. One row in a comparison table.
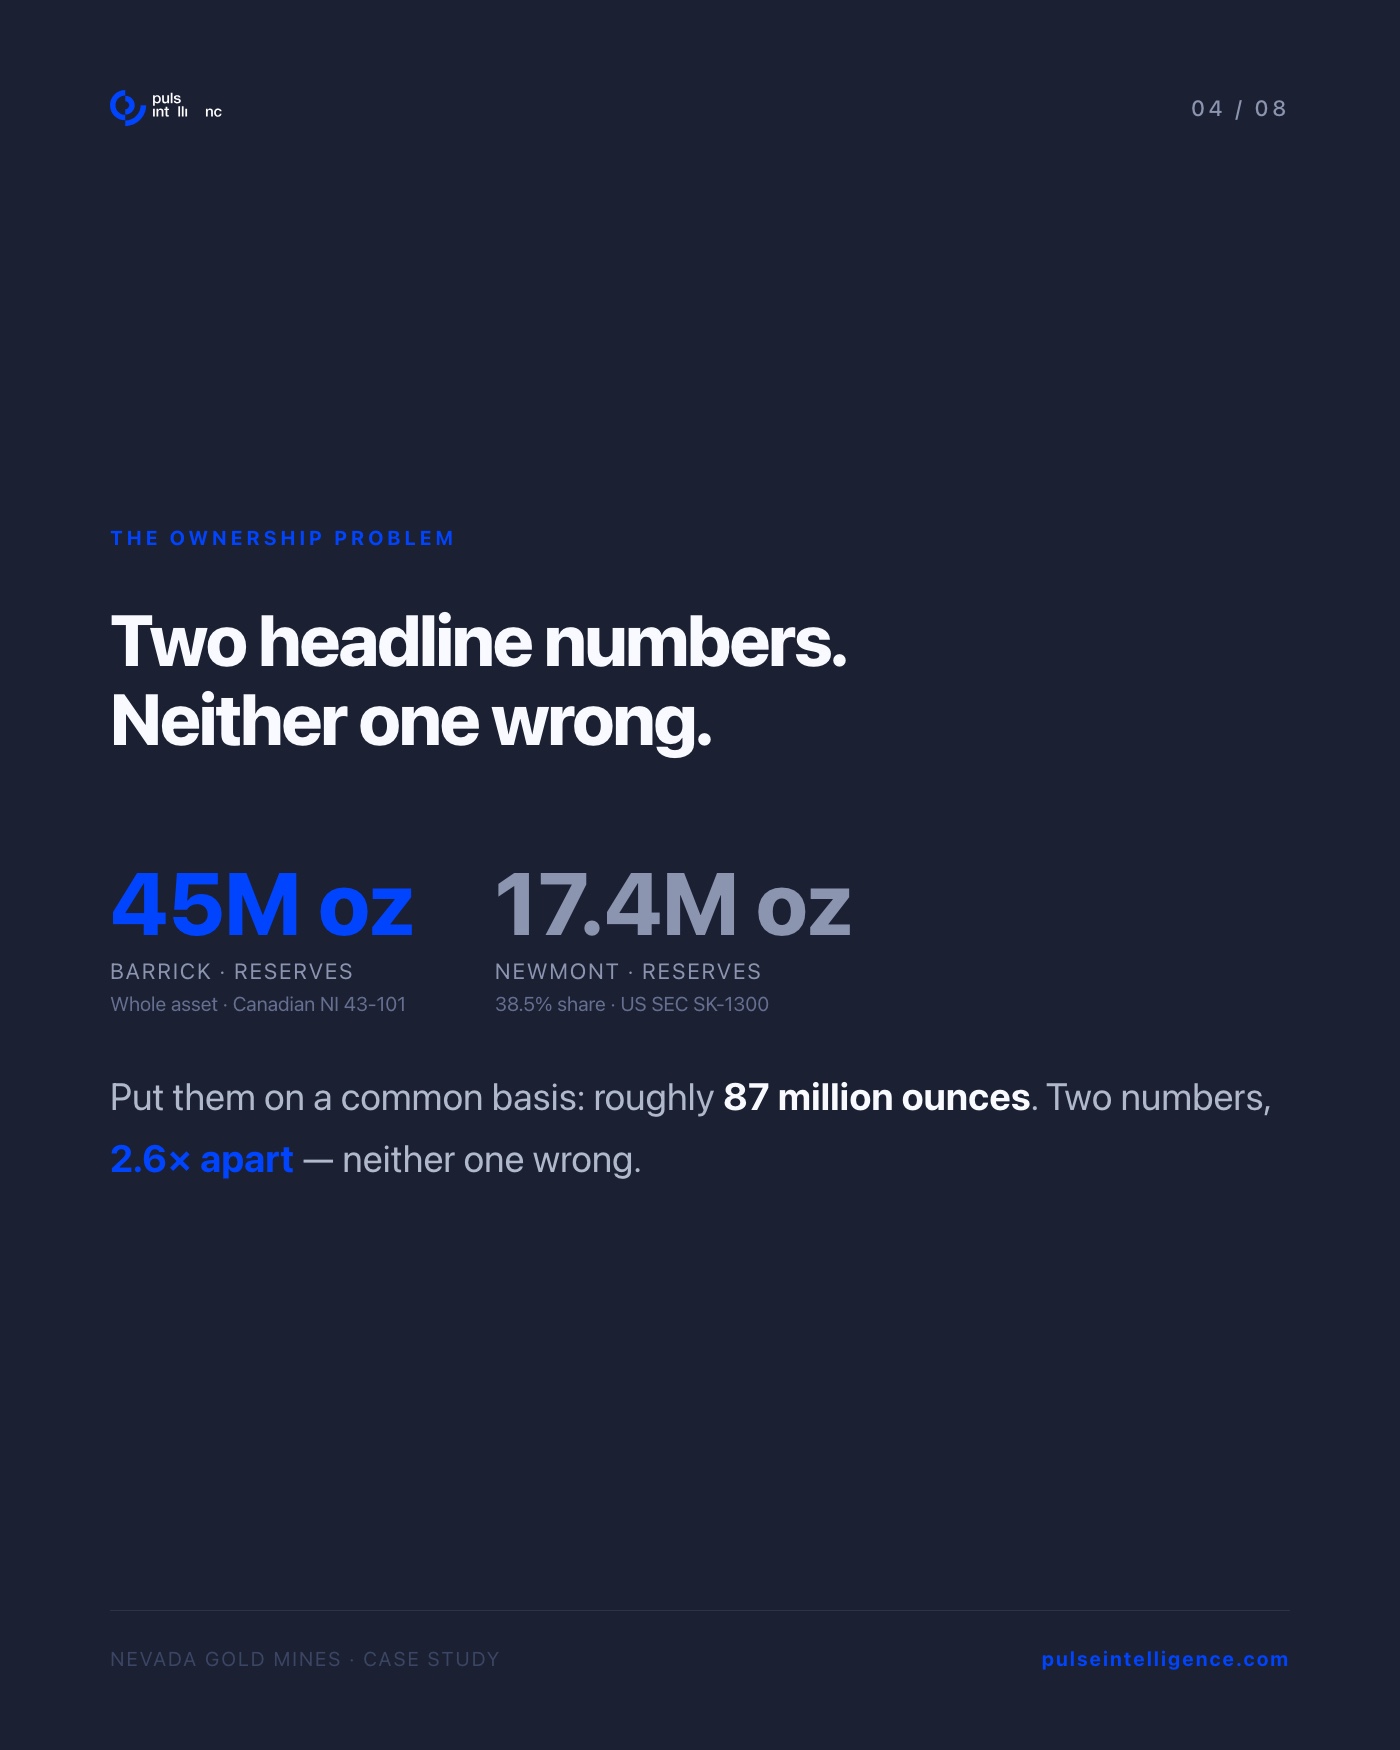
The reserve figures compound the problem. Barrick reports 45 million ounces of proven and probable reserves — on a 100% asset basis, under NI 43-101. Newmont reports 17.4 million ounces — as their 38.5% attributable share, under SEC SK-1300. On a common ownership basis, combining both disclosures, the figure is closer to 87 million ounces. The two headline numbers are 2.6 times apart, and both are technically correct.
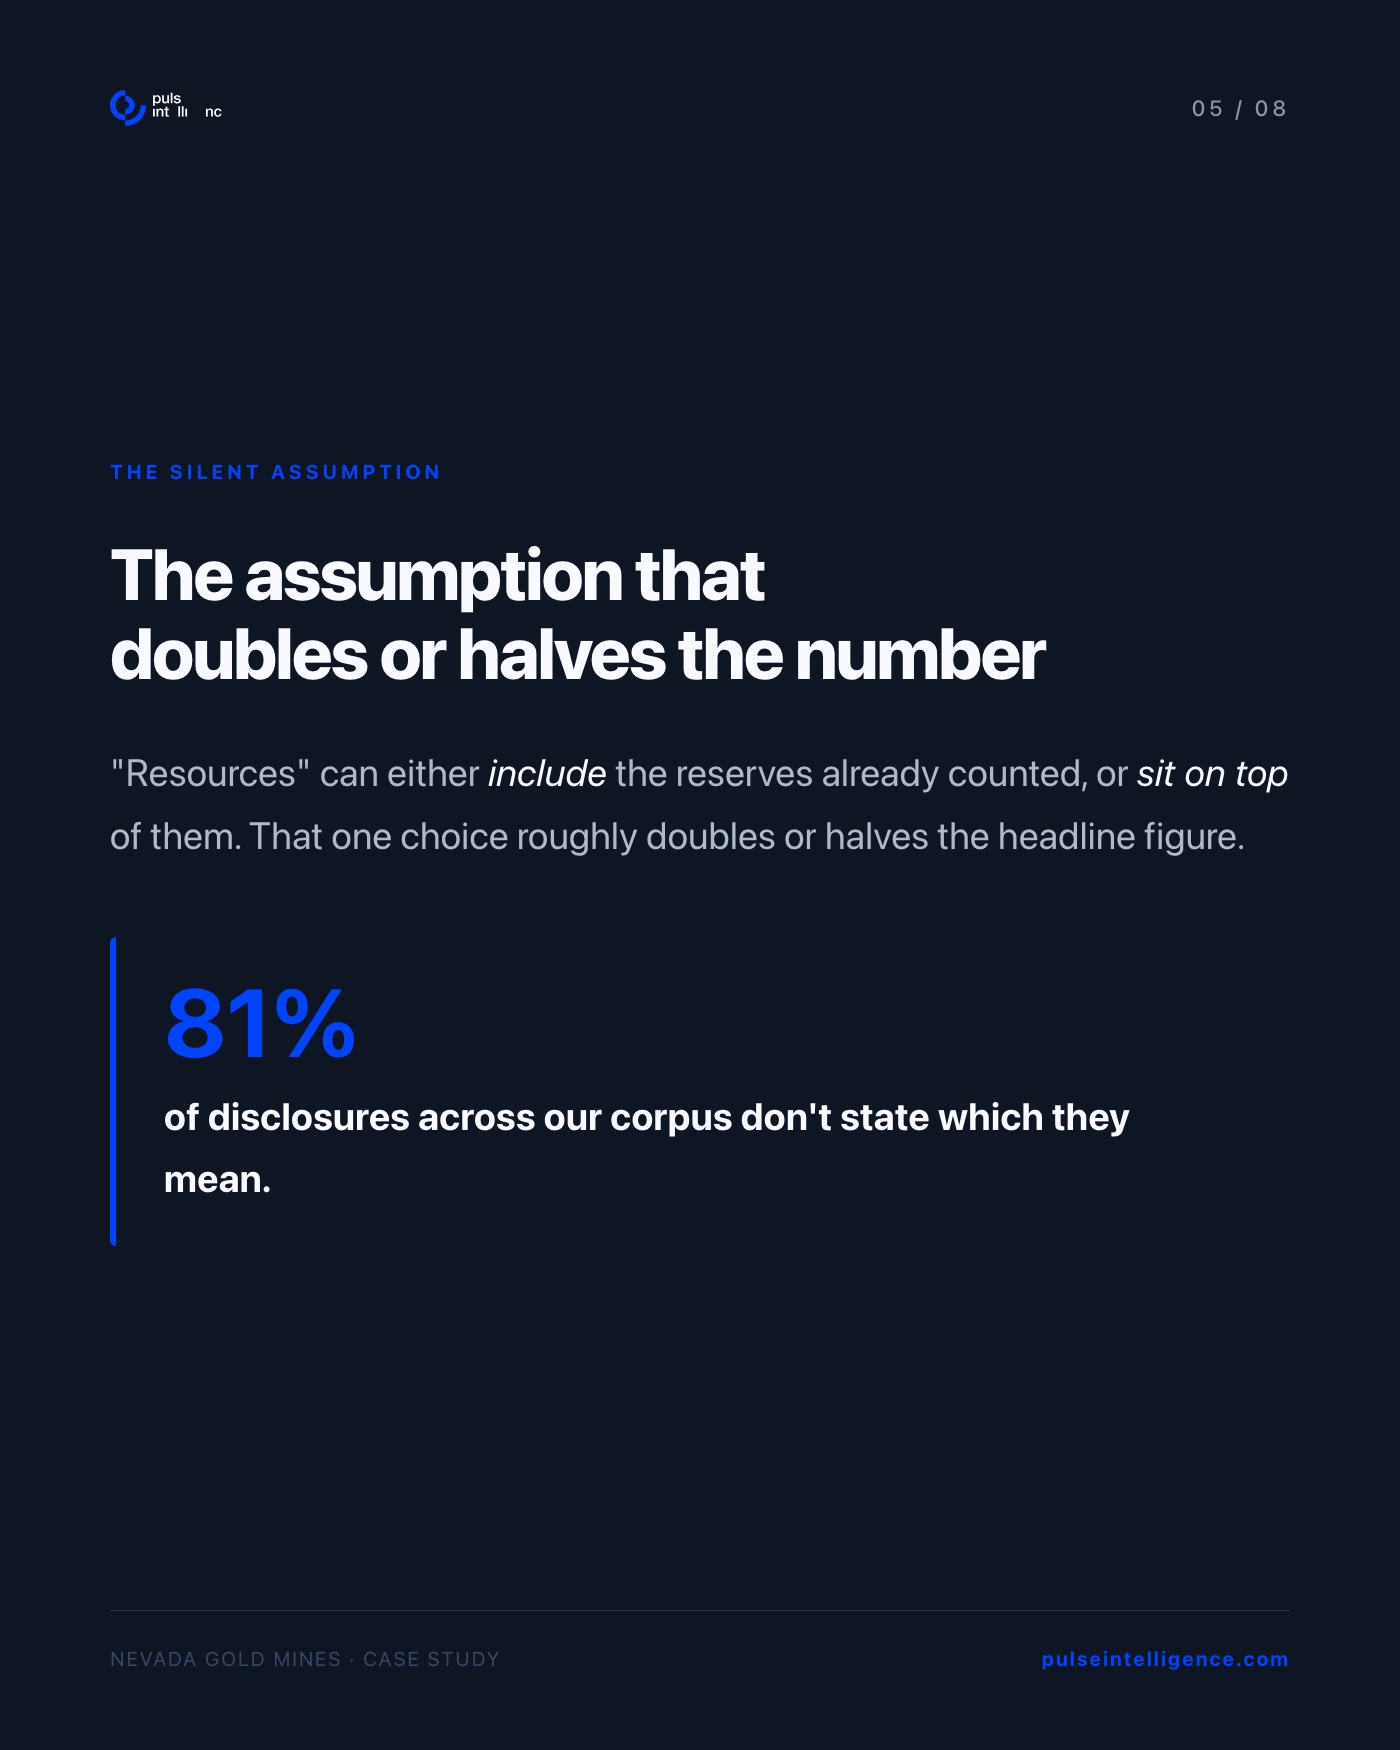
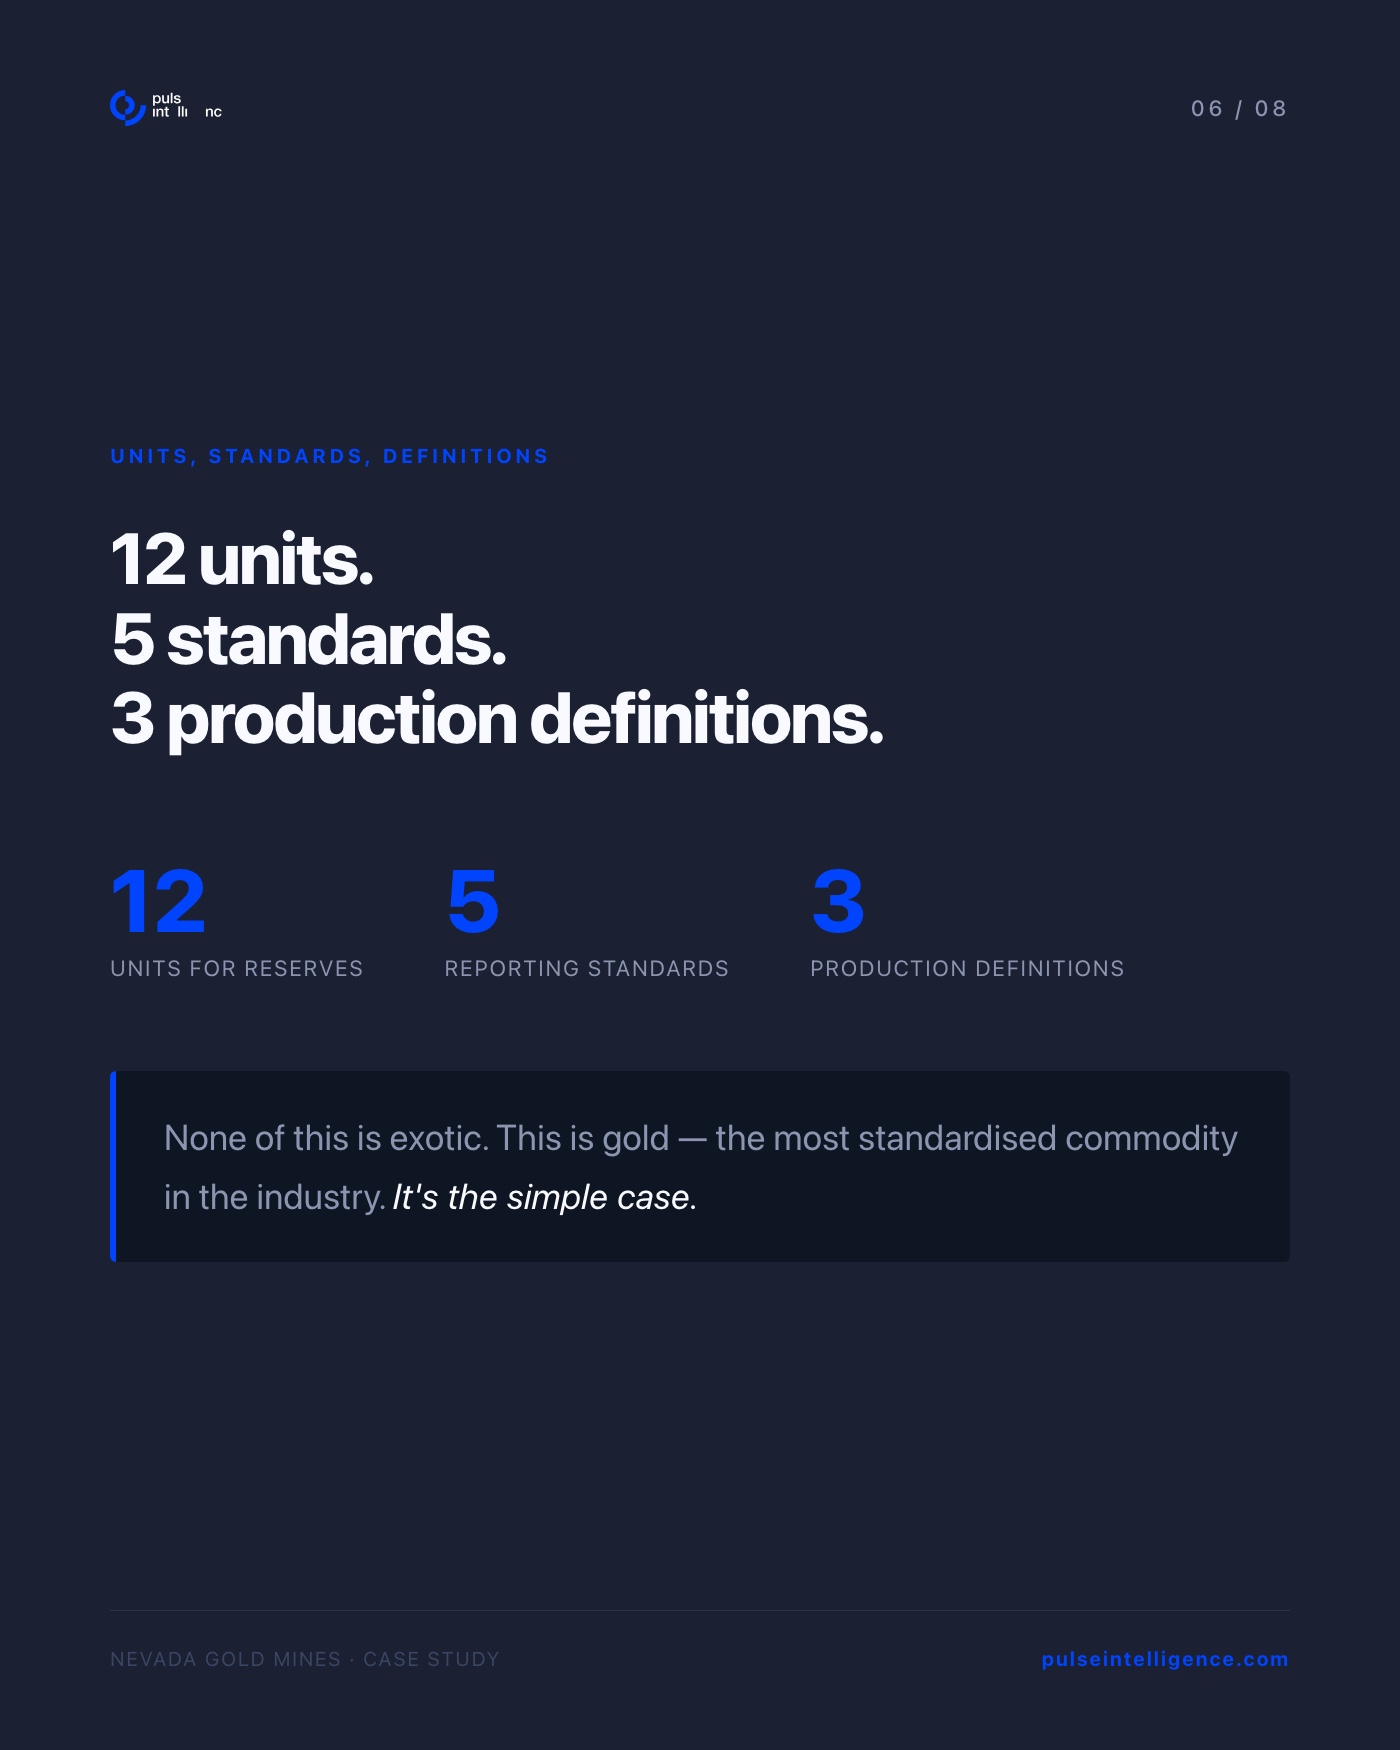
Then there is the silent assumption. Mineral resources can be stated two ways: inclusive of reserves already counted within them, or exclusive — sitting on top of them as an additional figure. That one unstated choice doubles or halves the headline resource number. Across the Pulse database, 81% of reserve and resource disclosures don't state which convention they use. Add 12 different units of measurement, five major reporting standards (NI 43-101, JORC, SAMREC, SK-1300 and PERC), and three different production definitions for the same metal in the same quarter — mined, refined, sold — and the reconciliation problem comes into full view.
This is gold: the most standardised, most-reported commodity in the mining industry. It is the easy case.
The eight slides above walk through each layer — corporate structure, ownership basis, reserve reporting, resource classification, and unit normalisation — as they apply to Nevada Gold Mines specifically. The full case study, including source citations, is available to download below.
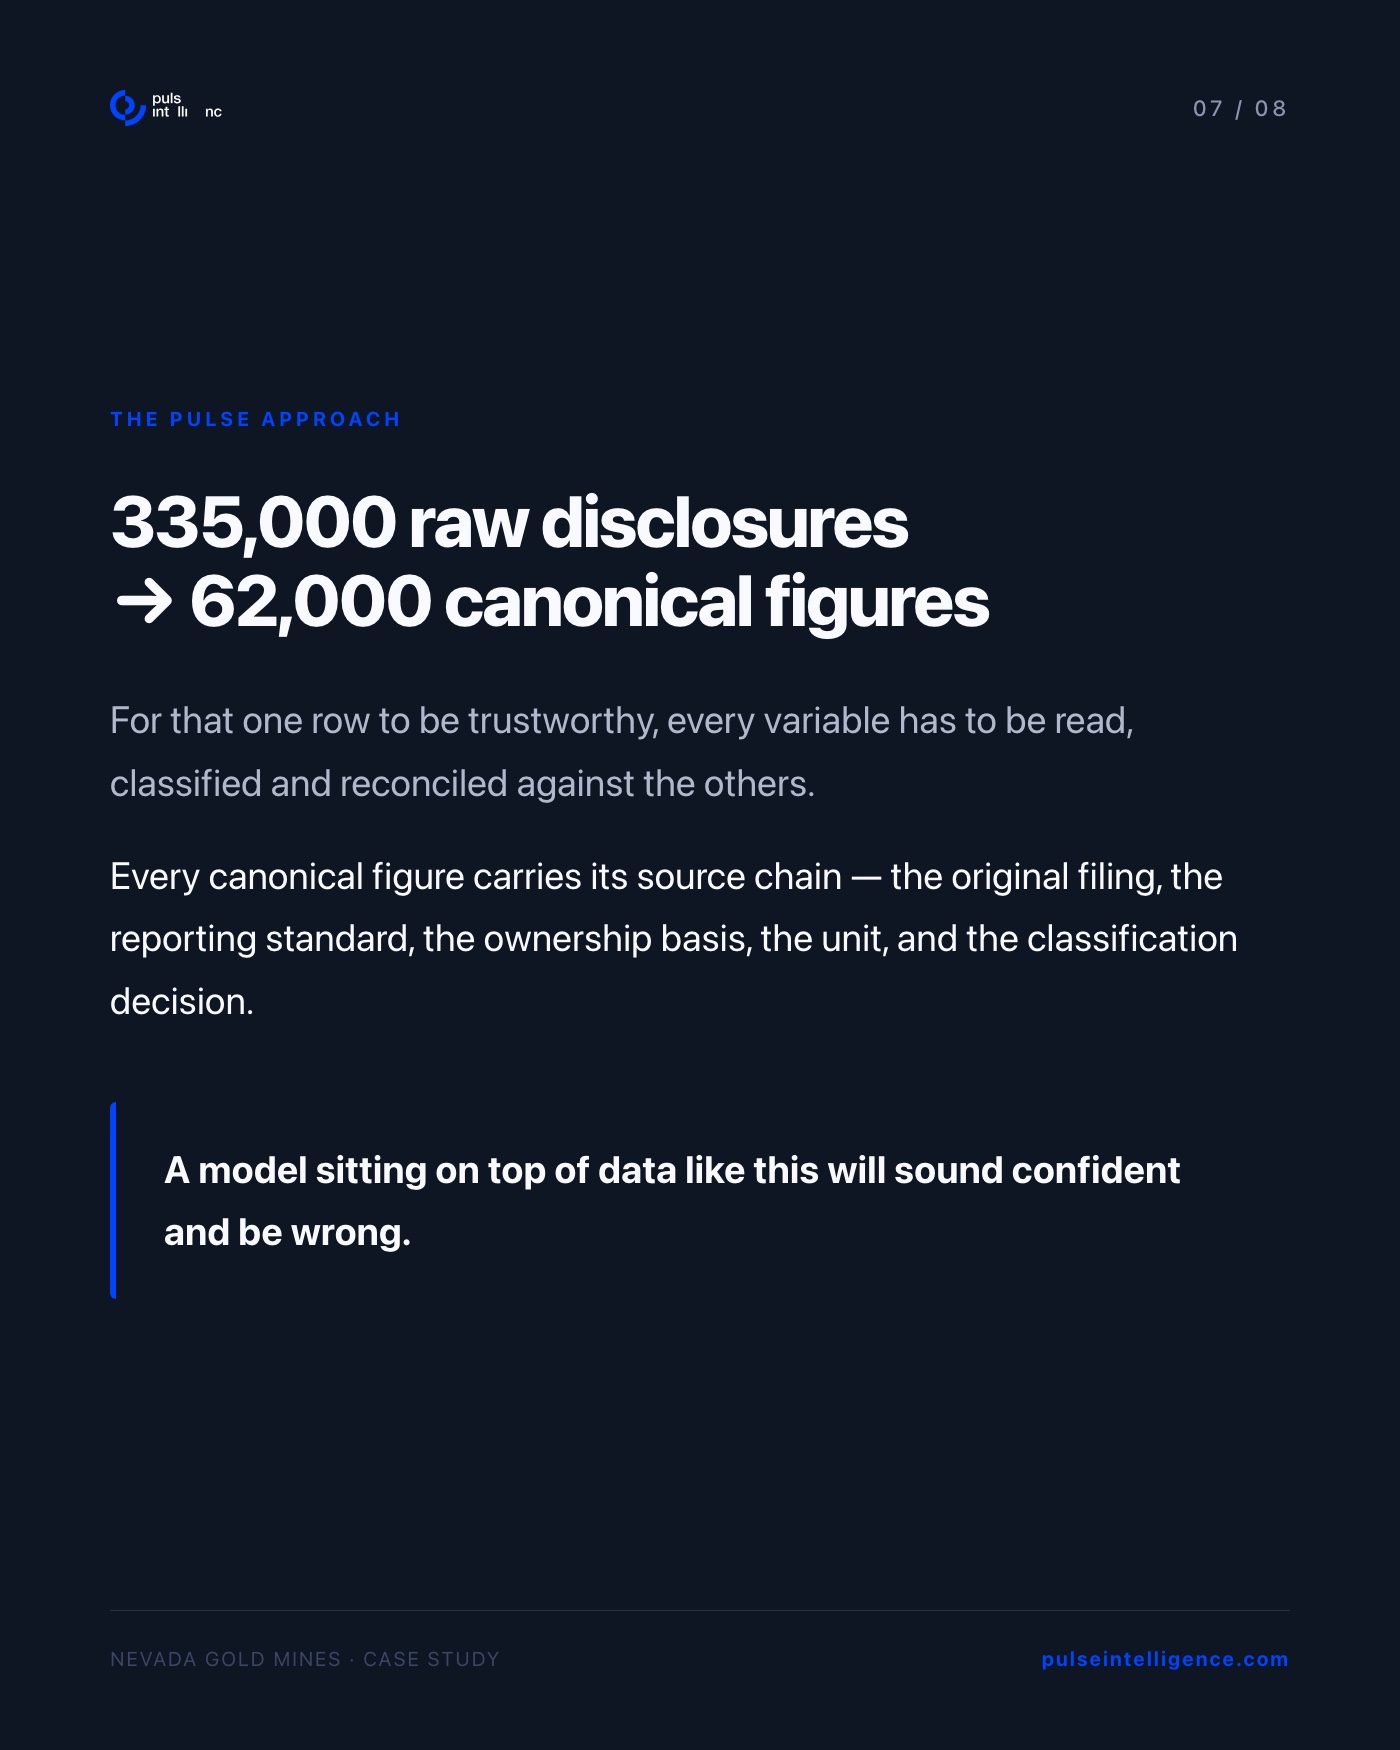
Resolving numbers like these is not a modelling problem. It is a data infrastructure problem. Pulse processes over 335,000 raw reserve and resource disclosures and resolves them to approximately 62,000 canonical figures. Every canonical figure carries its full source chain: the filing, the reporting standard, the ownership basis, the unit, and every classification decision made in the process. A model that sits on top of data resolved to this level will be reliable. One that doesn't will sound confident and be wrong.
The layer that decides which number to trust, and can show its work, is the only part that matters. It is also the part nobody sees.
Less searching. More strategising.™
Where does your team's data infrastructure sit today?
Answer 10 questions. Get a private diagnostic on your AI readiness — in minutes.
Less Searching. More Strategising.™
See the platform running on real mining data. Book a demo to see what this looks like for your team.