CMOC mined 65,305 tonnes of cobalt in the first half. It sold 5,727.
That is 8.8% of production. The rest went to stock, which closed the half at 168,397 tonnes of contained cobalt, up 54.75% since December.
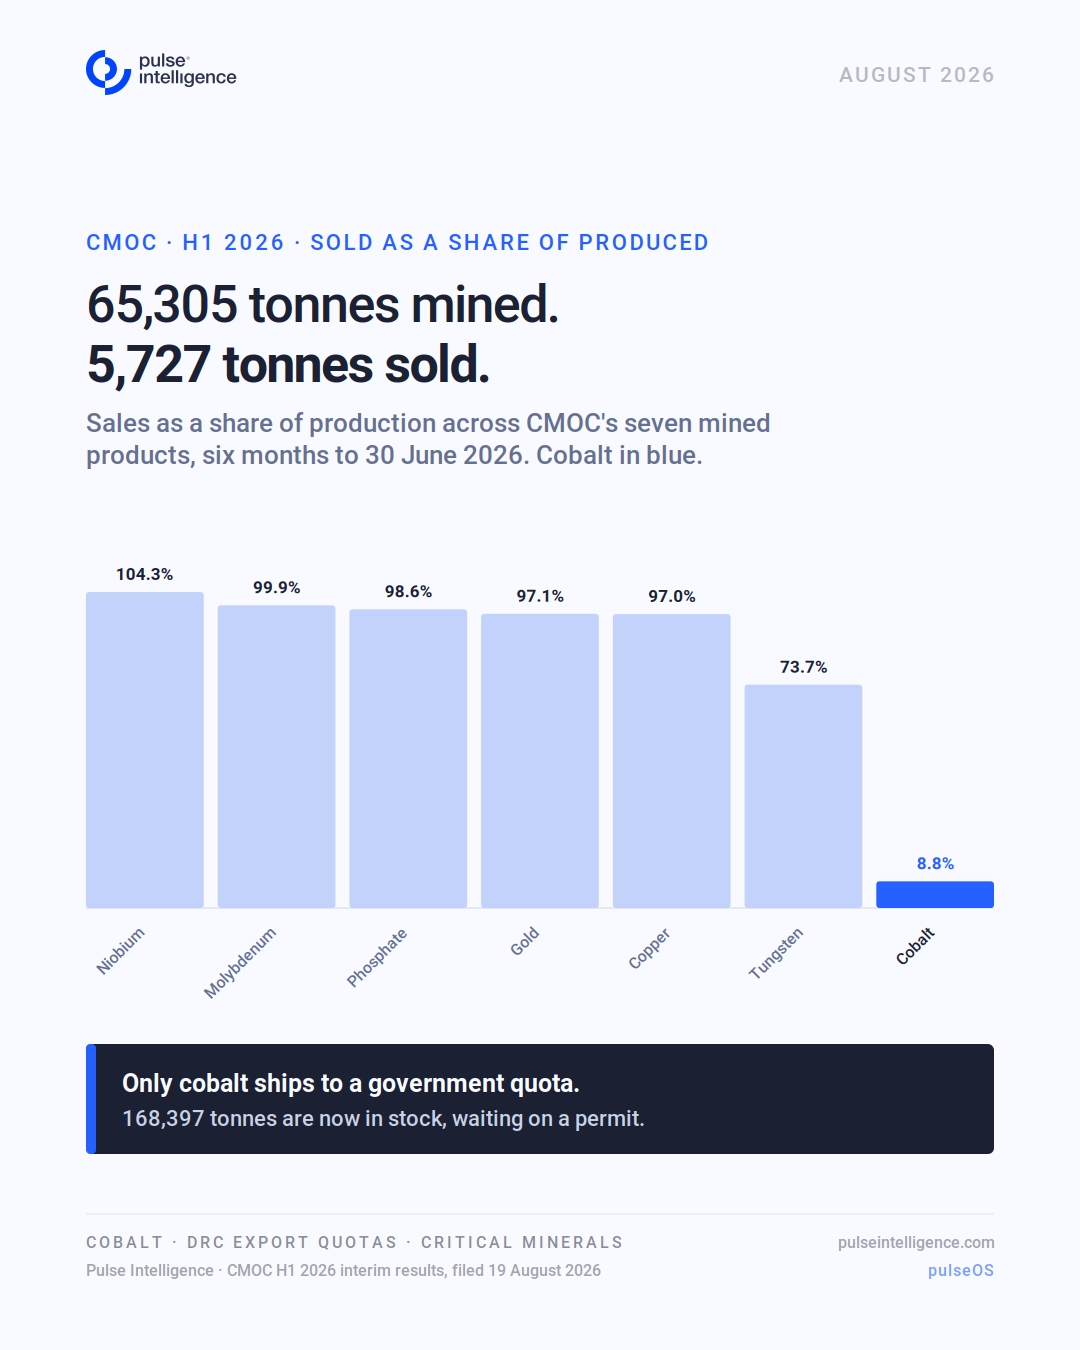
Read the rest of the same table, and that number stops looking like an operating failure.
Niobium: sold 104.3% of what it produced, drawing stock down. Molybdenum: 99.9%. Phosphate: 98.6%. Gold: 97.1%. Copper: 97.0%. Tungsten: 73.7%. Cobalt: 8.8%.
Five of those sit between 97% and 104%. Then tungsten steps down. Then cobalt falls off a cliff.
Cobalt is the only line in that table whose shipped volume is set by a host-government quota rather than by a mine plan. The Democratic Republic of Congo replaced its export ban with a quota system last October, and unshipped allocations were forfeited to the state at the end of June.
Cobalt revenue fell 44.87% while the cobalt price rose 94.22%.
Mine planning has always answered to grade, strip ratio and recovery. For a lengthening list of commodities, it now also answers to an export licence issued by someone with entirely different objectives.
That variable does not sit in any of the usual fields.
Less searching. More strategising.™
Where does your team's data infrastructure sit today?
Answer 10 questions. Get a private diagnostic on your AI readiness — in minutes.
Less Searching. More Strategising.™
See the platform running on real mining data. Book a demo to see what this looks like for your team.