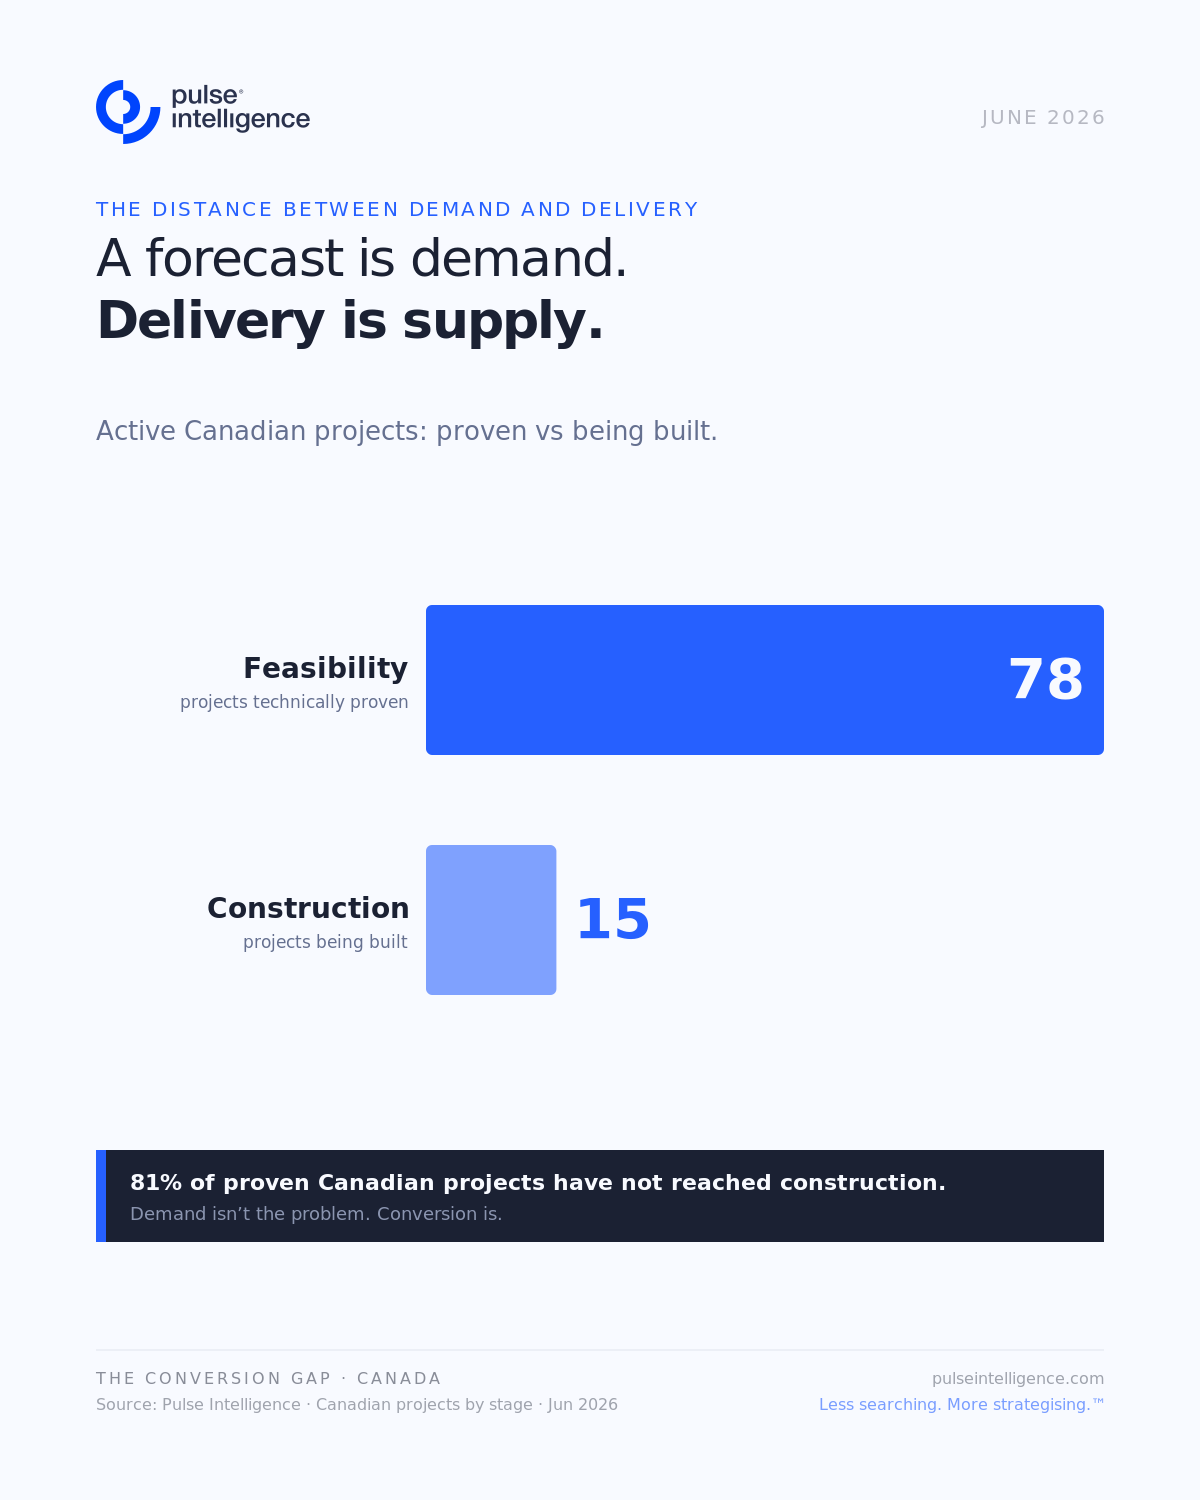
78 Canadian mineral projects have reached a completed feasibility study. 15 are in construction.
That gap — not the US$4.7 trillion infrastructure headline everyone is sharing — is the real story.
PwC and Oxford Economics put resources at the top of Canada's build to 2050: US$1.6 trillion, the largest single sector. On paper, the capital case for mining has rarely looked stronger.
A forecast is demand. Delivery is supply. The distance between them is where the ambition gets won or lost.
In our data, 78 projects sit at feasibility — the stage where a deposit is technically proven and economically modelled — against 15 that have moved into construction. The bottleneck isn't geology, capital or demand. It's the conversion from proven to built: approval timelines, overlapping jurisdictions, and the months it takes capital to commit with confidence.
PwC reaches the same conclusion from the top down: capital commits at scale only once it can trust what it's looking at.
None of this is unique to Canada. Every resource jurisdiction chasing the same pool of global capital faces the same throttle. The winners won't be the ones with the most deposits. They'll be the ones that move a project from feasibility to financed fastest, with the cleanest audit trail behind every number.
Speed of decision is the edge. And that rests entirely on how quickly the people holding the capital can trust what they're looking at.
The forecast is the easy part. Execution is the whole game.
Less searching. More strategising.™
Where does your team's data infrastructure sit today?
Answer 10 questions. Get a private diagnostic on your AI readiness — in minutes.
Less Searching. More Strategising.™
See the platform running on real mining data. Book a demo to see what this looks like for your team.