FREE RESEARCH NOTE. On the ASX the market prices cost harder than it does in Toronto. What it prices beyond cost is geography.
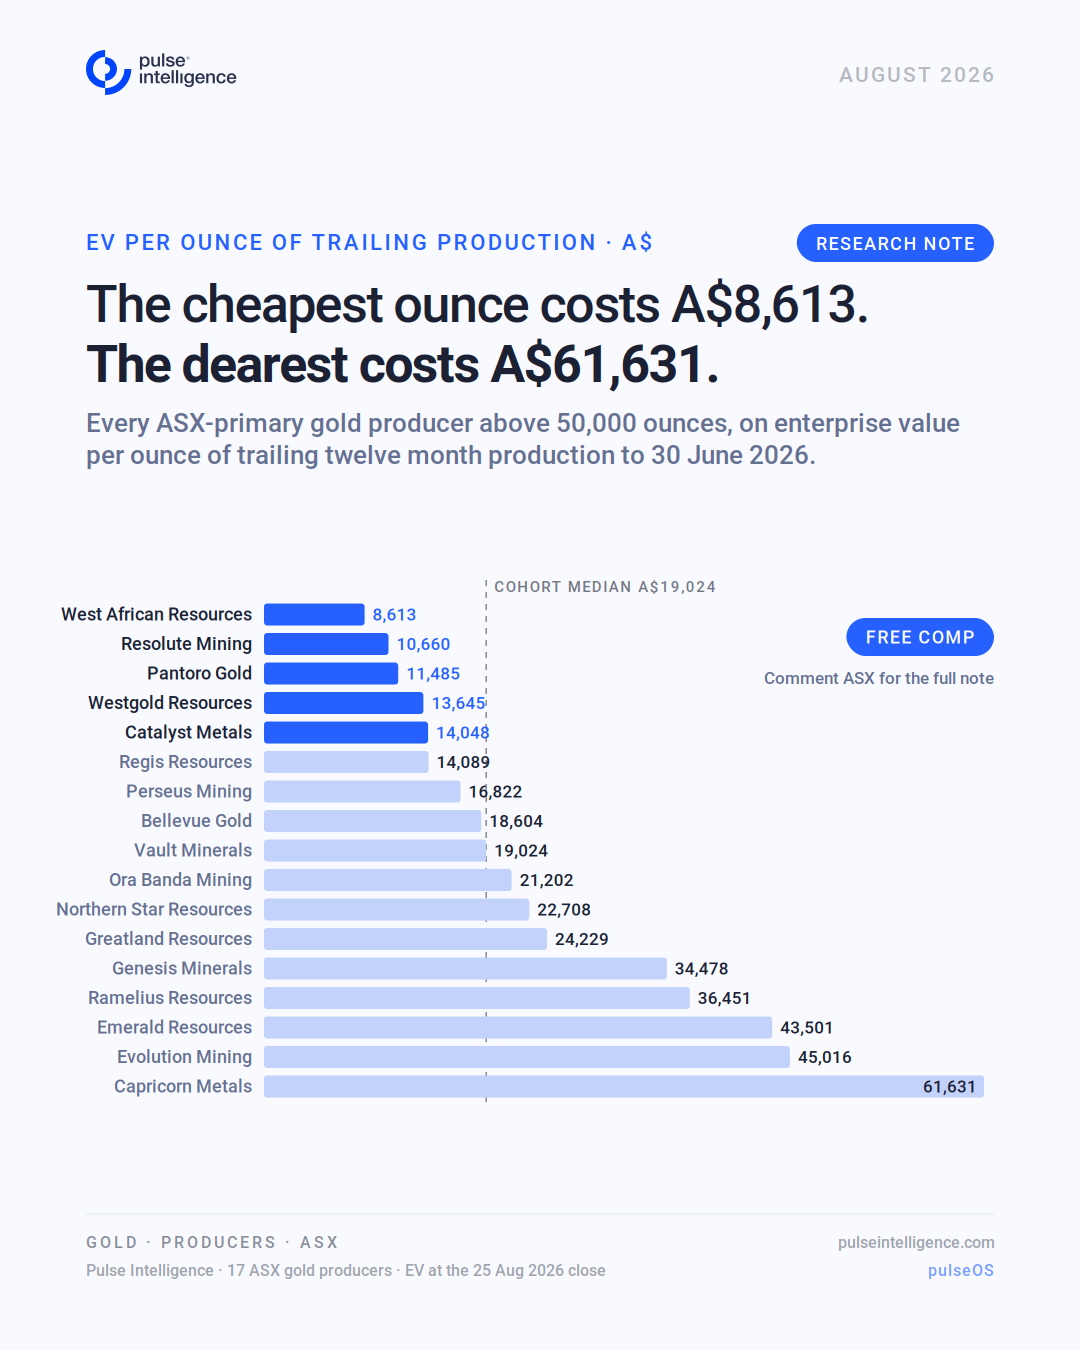
We screened every ASX-listed gold producer above 50,000 ounces on enterprise value per ounce of trailing twelve-month production to 30 June 2026. Cohort median A$19,024.
The cheapest ounce of gold production on the ASX costs A$8,613. The dearest costs A$61,631.
Same metal. Same day. Seventeen producers on one basis, and 7.2x between the top and the bottom of the board.
Most of the spread is just cost
The correlation between all-in sustaining cost and EV per ounce is -0.77, tighter than the -0.64 the same screen throws on the TSX. The five cheapest ounces average a 56% margin; the five dearest average 71%. The market is pricing the cost curve, and it is right to.
What is left over is geography
West African Resources, Resolute Mining and Perseus Mining rank first, second and seventh. West African runs the sixth-widest margin in the cohort on the sixth-lowest cost base, and still trades at half of Perseus. All three mine in West Africa.
Then there is the part that has nothing to do with the mines
An ASX quarterly activities report reveals production, costs and a cash figure. It does not give you a balance sheet. Most screens are built from quarterlies.
Across these seventeen there is A$1,184m of lease liabilities and another A$1.3bn of deferred consideration, royalty obligations and option premiums, none of it inside a stated net cash figure. Four companies describe a position their own audited accounts do not support.
Westgold Resources states it is "100% debt free" and carries A$230.2m of obligations. Bellevue Gold reports A$100m of debt against A$240.8m of leases, so A$135m of net debt rather than A$106m of net cash. Genesis Minerals reports A$200m, where the accounts show A$303m. Evolution Mining announces net cash and shows A$69m of net debt.
None of that is concealment. Every figure is lodged with the ASX and audited or reviewed. It is simply not in the document the screen reads.
Enterprise value is market capitalisation less net cash. Get the cash wrong, and you get the multiple wrong, and the error lands hardest at the cheap end, which is exactly where anyone running this screen is looking.
Get the comp, free
The full 15-page comp: every producer's cost, margin, net cash, lease liabilities and off-balance-sheet obligations, an EV-per-reserve-ounce lens, and the Genesis/Vault merger read against the board. Every figure traced to a filing, on one basis, at one date.
Enter your email and we'll send the PDF straight over.
Less searching. More strategising.™
Built entirely from Pulse Intelligence data and the underlying company filings. Valuations, enterprise values, production and costs are point-in-time snapshots and change with the market and with each new filing. Company names are referenced as data points, not recommendations. For information only, not investment advice.
Where does your team's data infrastructure sit today?
Answer 10 questions. Get a private diagnostic on your AI readiness — in minutes.
Less Searching. More Strategising.™
See the platform running on real mining data. Book a demo to see what this looks like for your team.