Every quarter, ASX-listed explorers report what they spent on exploration and evaluation. Using Pulse data for the four quarters from Q3 25 to Q2 26, covering those explorers alongside the ASX-listed majors and mid-tiers, we built a constant panel of 661 companies. This is the flash edition, and it sets the baseline Q3 26 will be measured against. The full ten-page report is free to download at the foot of this page.
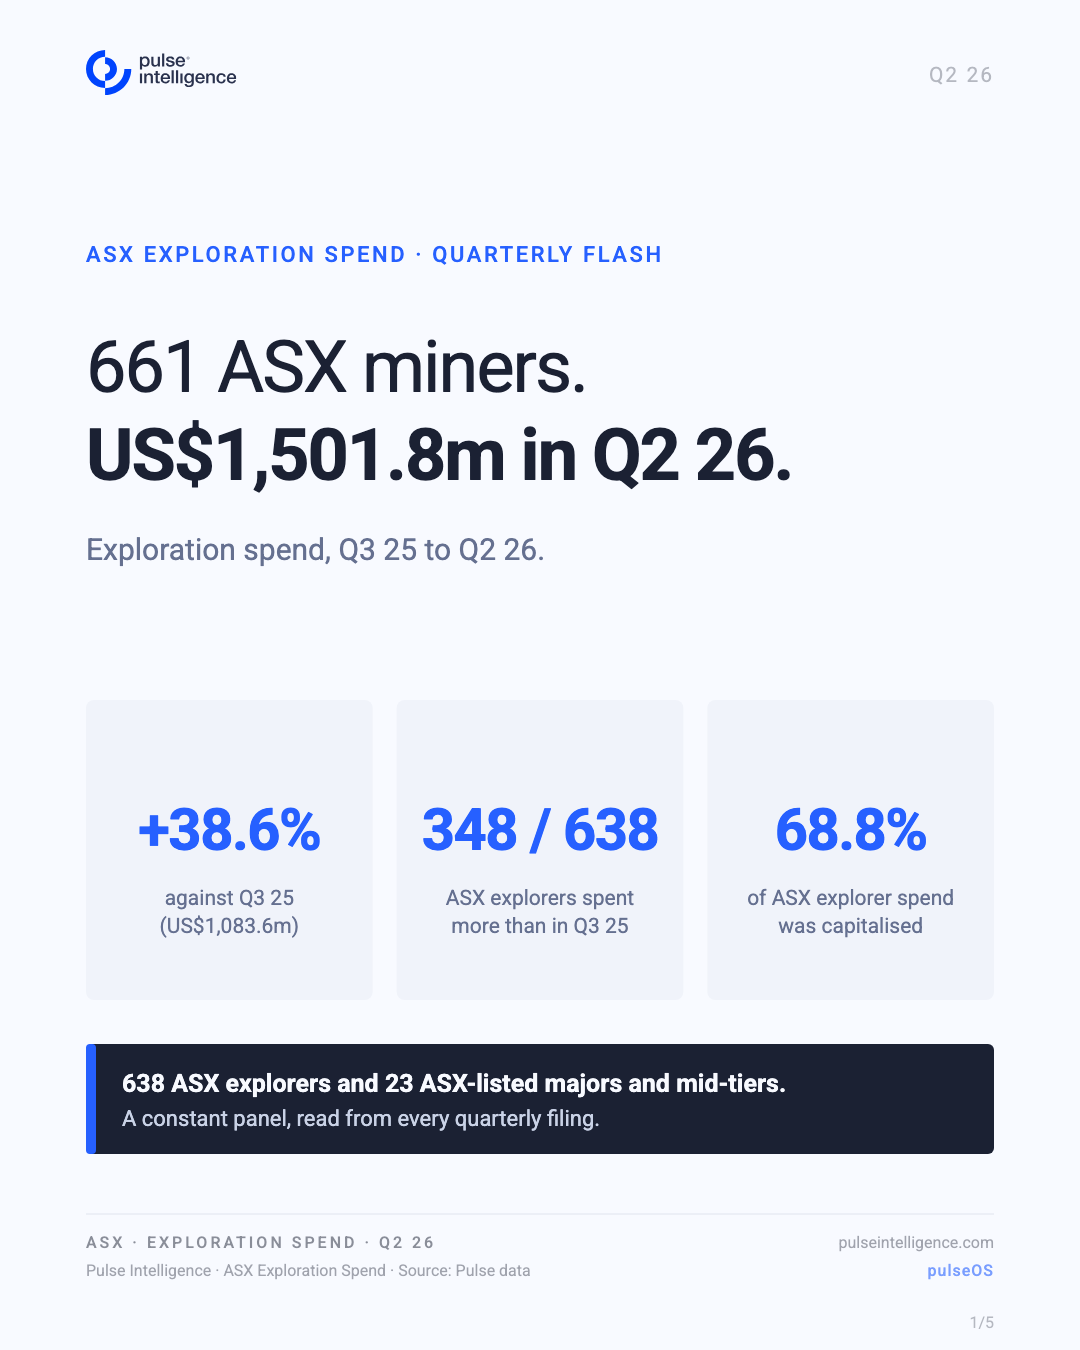
How much did ASX miners spend on exploration in Q2 26?
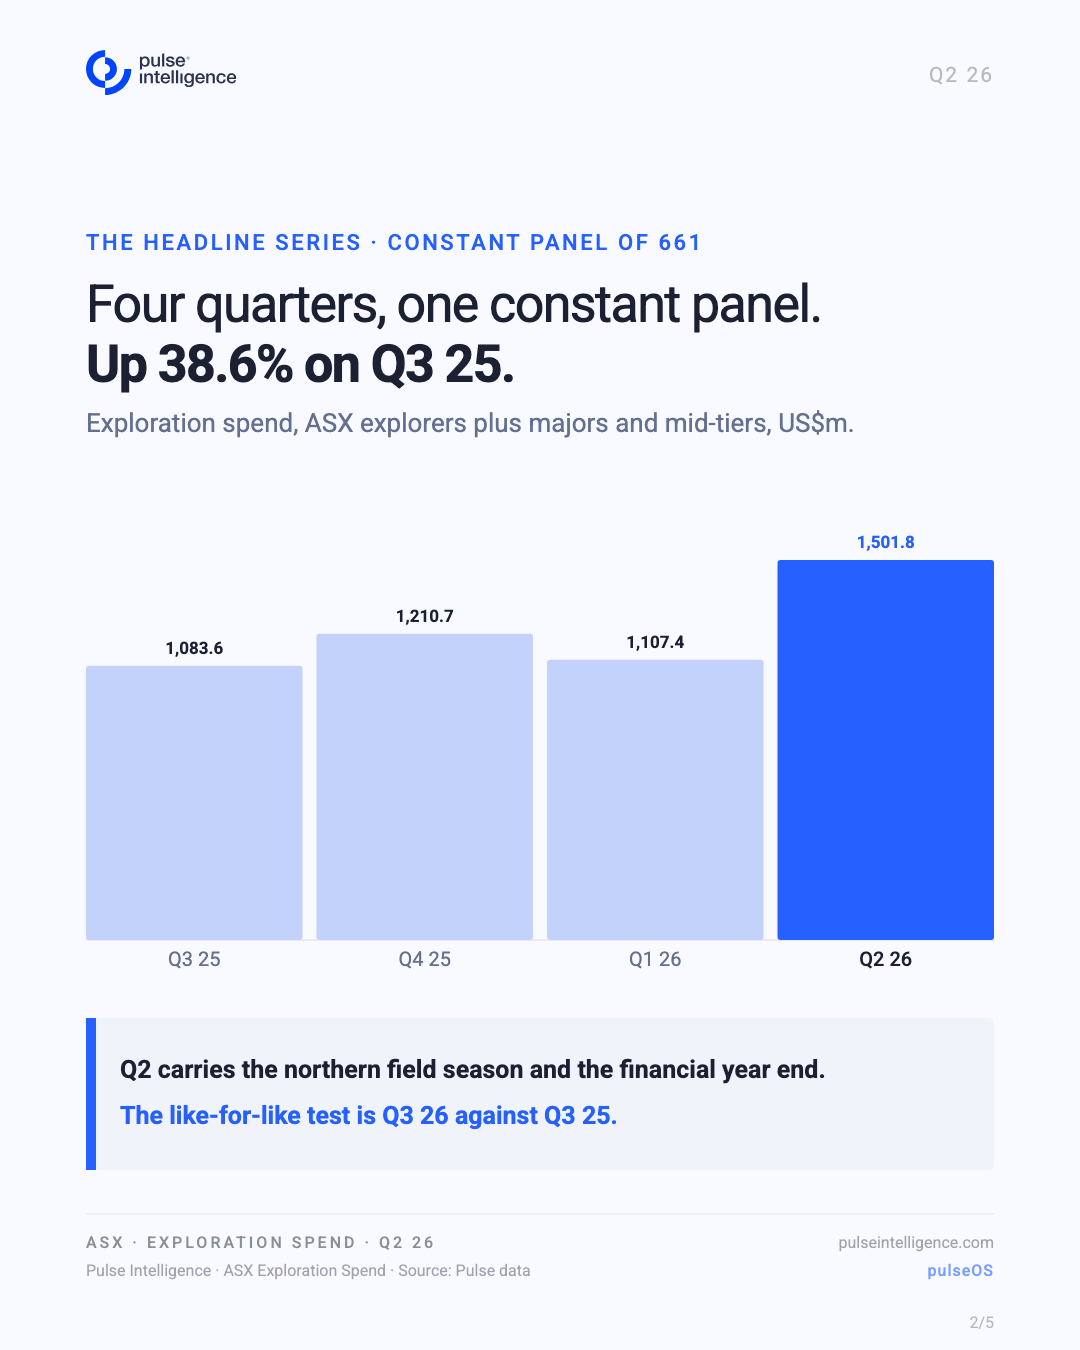
US$1,501.8m, across a constant panel of 661 companies: 638 ASX explorers and 23 ASX-listed majors and mid-tiers. That is up 38.6% on Q3 25 (US$1,083.6m), 24.0% on Q4 25 (US$1,210.7m) and 35.6% on Q1 26 (US$1,107.4m).
The explorers spent US$641.0m and the majors and mid-tiers US$860.8m. Both groups rose against Q3 25, the explorers by 36.5% and the majors and mid-tiers by 40.2%.
How much of the rise is the Australian dollar?
Some of it. The Australian dollar averaged US$0.654 in Q3 25 and US$0.710 in Q2 26, so the US dollar series rises faster than the local one. ASX explorer spend rose 36.5% in US dollars, 27.0% in Australian dollars and 25.9% at constant exchange rates. Take the currency out and the quarter is still up by a quarter.
The season matters too. Q2 carries the northern field season and the Australian financial year end, so the like-for-like test is Q3 26 against Q3 25. That is what the next edition will measure.
Is the increase broad, or a few large programmes?
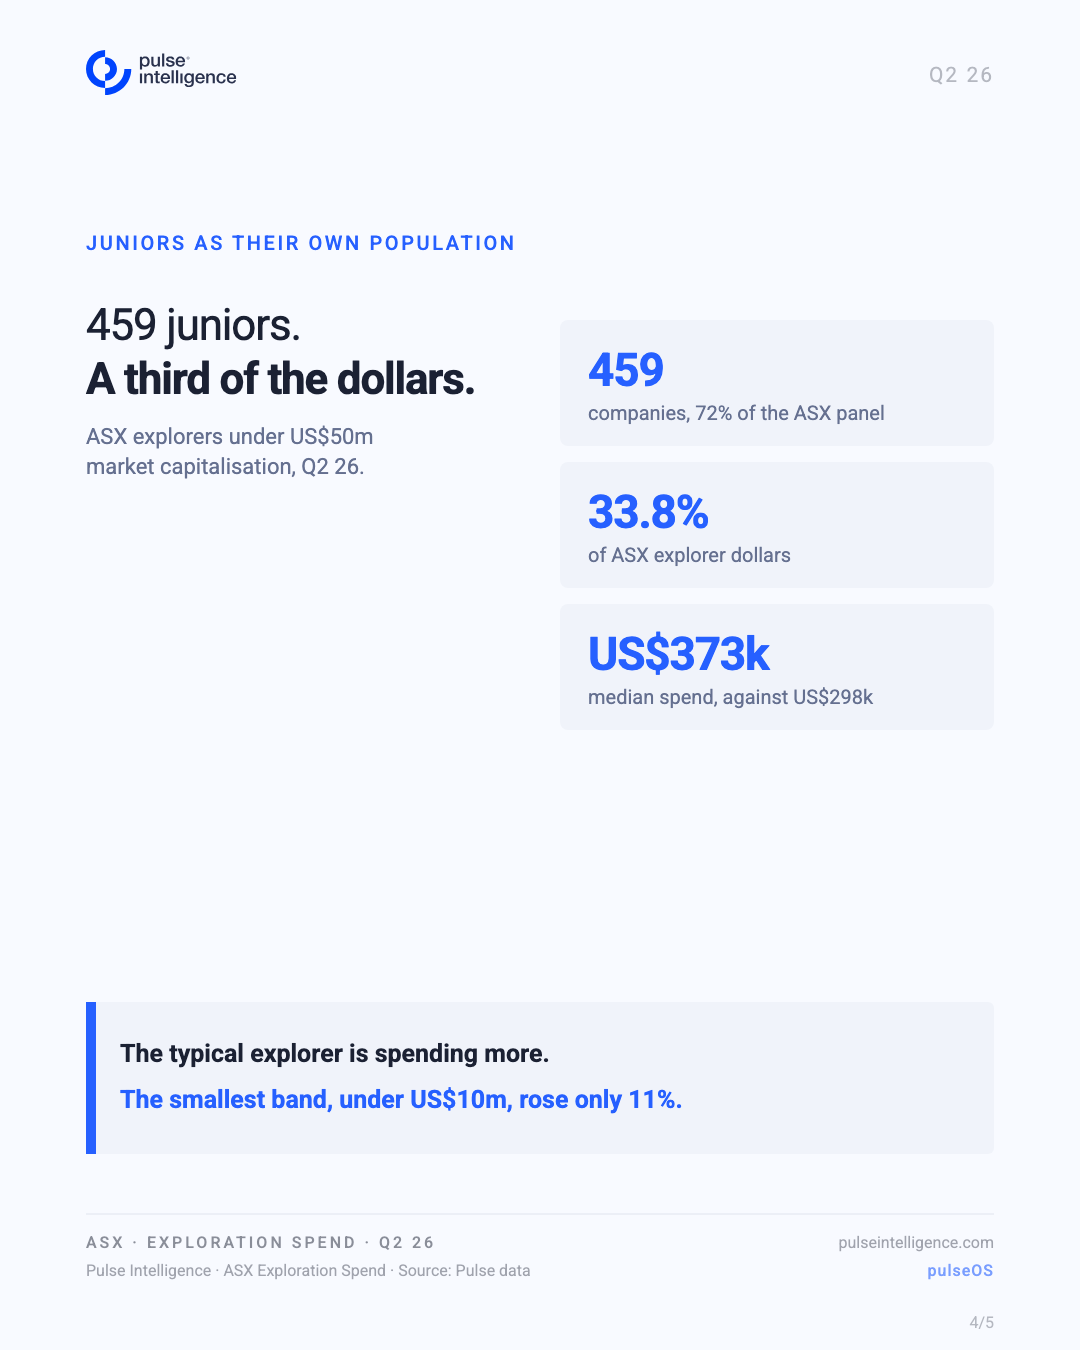
Broad. 348 of the 638 ASX explorers spent more in Q2 26 than in Q3 25, 272 spent less and 18 were unchanged. The median company spent US$373k, against US$298k, and the interquartile range moved from US$92k to US$711k in Q3 25 to US$123k to US$1,100k in Q2 26.
At the top, the dollars concentrate the way you would expect. The ten largest spenders account for 52.1% of Q2 26 spend, US$782.6m, and nine of those ten are majors or mid-tiers. The 50 largest account for 72% across the whole panel.
Where is the money going?
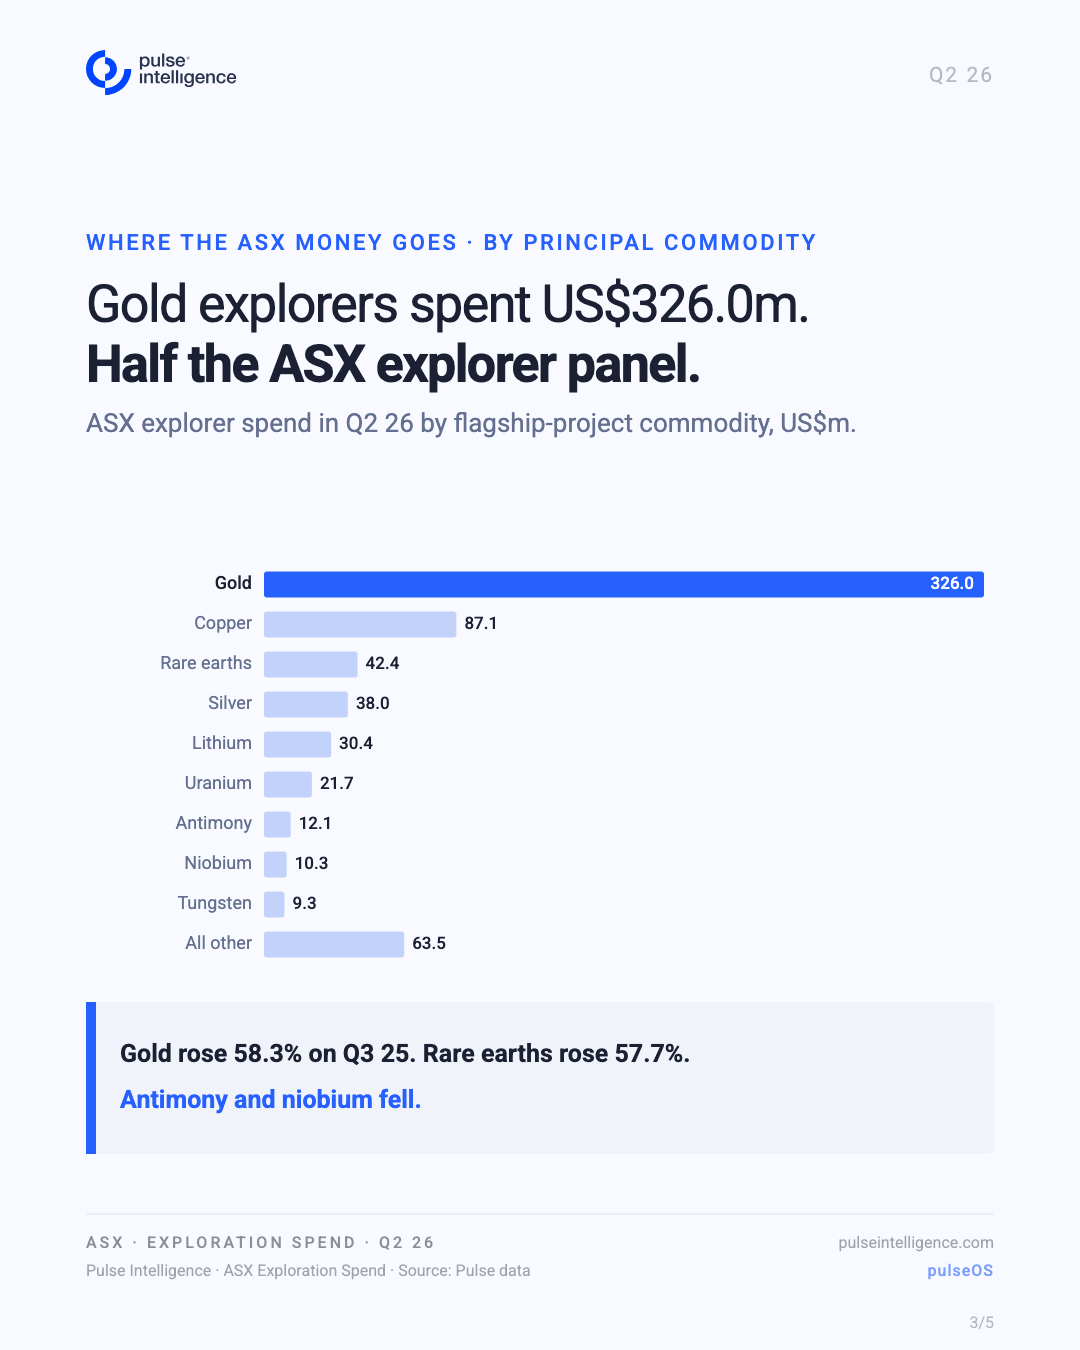
Gold, by a distance. Gold explorers spent US$326.0m in Q2 26, half the ASX explorer panel and up 58.3% on Q3 25. Copper followed at US$87.1m (+30.8%), then rare earths at US$42.4m (+57.7%), silver at US$38.0m (+39.1%) and lithium at US$30.4m (+17.7%). Uranium rose 43.3% to US$21.7m. Antimony (-8.4%) and niobium (-10.2%) went the other way.
By geography, ASX explorers put 56% of their Q2 26 dollars into Australian assets: US$357.6m across 378 companies, up 48.9%. The 260 companies exploring outside Australia spent US$283.4m, up 23.6%, so the home share grew twice as fast as the rest.
What are the juniors doing?
Treated as their own population, the 459 panel companies under US$50m market capitalisation make up 72% of the ASX panel and spent 33.8% of the ASX explorer dollars in Q2 26.
The typical explorer is spending more, but not evenly. The US$10m to US$50m band rose from US$108.2m to US$157.2m. The smallest band, under US$10m, rose only 11%, from US$53.5m to US$59.5m.
Why does capitalisation matter?
Because most of the spend never reaches the income statement. 68.8% of ASX explorer spend was capitalised in Q2 26. Of the A$890.8m spent by Australian-dollar reporters, A$613.1m was capitalised and A$277.7m expensed. Two dollars in three are capitalised, and a measure that counts only one of those lines misses the other.
How were the figures built?
The explorer panel is every ASX-listed exploration company that reports quarterly cash flows, entering only with a figure in all four quarters. Exploration spend is taken from Pulse data, expensed plus capitalised, excluding tenement and entity acquisitions. Across the four quarters that is 2,576 lodgements, each read in full.
Majors and mid-tiers are ASX-listed miners with annual revenue of at least US$500 million. Of the 32 that qualify, the 23 that report exploration spend each quarter are in the figures, each on its own reported line; the report records the basis of every one. Quarters are calendar quarters, and US dollar figures use each quarter's average rate from the US Federal Reserve G.5 releases.
What is in the full report?
- The 23 majors and mid-tiers company by company, four quarters each, with the basis of every reported line
- Spend by commodity across all four quarters, and the largest countries outside Australia
- Juniors by market capitalisation band, from under US$10m to over US$1bn
- Concentration, and the largest movers in each direction
- A status for every one of the 752 mining companies listed on the ASX
Download the full report
ASX Exploration Spend: Q3 25 to Q2 26 runs to ten pages. It is free.
Data as held in Pulse Intelligence at 11 October 2026. Published for general information. Not investment advice.
About Pulse Intelligence
Pulse Intelligence is the technology and infrastructure layer for mining data. We digitise, validate and structure exchange disclosure, NI 43-101, JORC and S-K 1300 technical reports, government archives and historical geological records, then serve them through a platform, a documented API and the Pulse MCP, so the work runs inside your own model and your own systems. More than 450 investment and audit grade metrics across 30,295 mining assets, each figure traced to the page of the filing it came from.
Less searching. More strategising.™